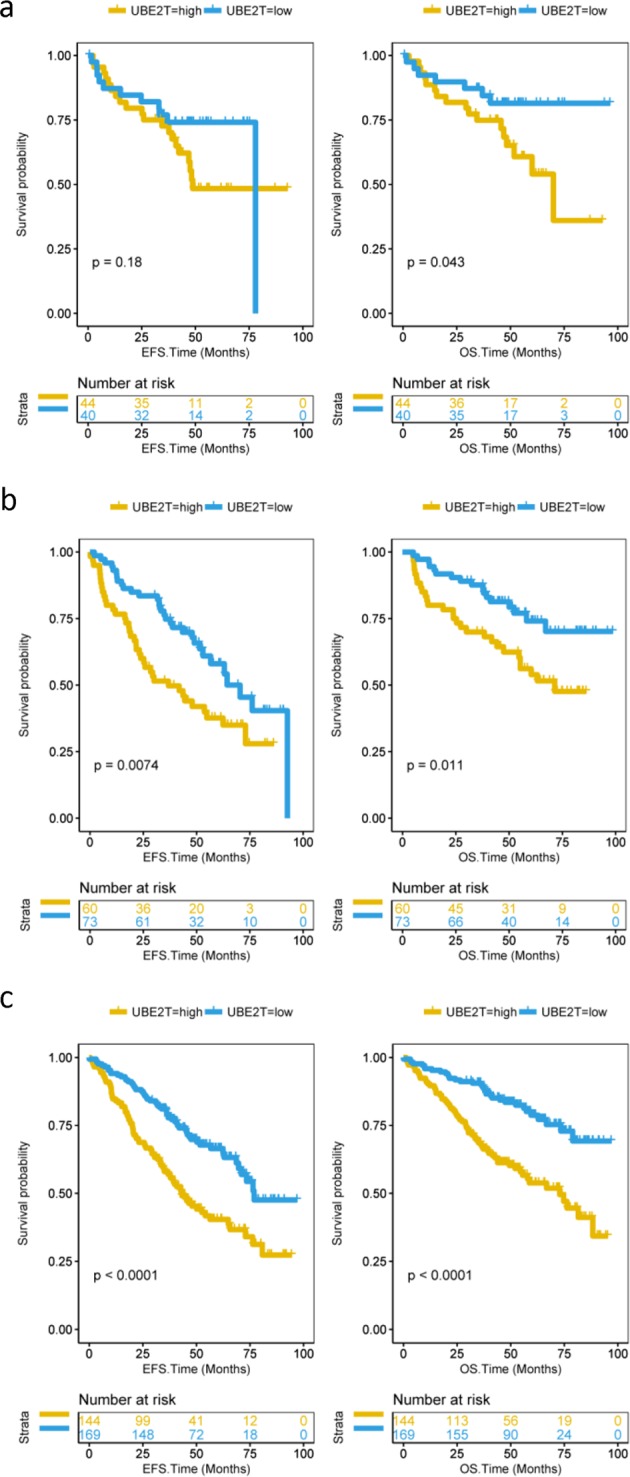
Fig. 4.

The expression of UBE2T in patients with different serotype MM. a EFS and OS between UBE2T high and low groups in patients with FLC serotype MM. Compared to UBE2T low group patients, high group patients had a lower OS. Log-rank test. EFS: P = 0.18; OS: P = 0.043. b EFS and OS between UBE2T high and low groups in patients with IgA serotype MM. Compared to UBE2T low group patients, high group patients had lower EFS and OS. Log-rank test. EFS: P = 0.0074; OS: P = 0.011. c EFS and OS between UBE2T high and low groups in patients with IgG serotype MM. Compared to UBE2T low group patients, high group patients had lower EFS and OS. Log-rank test. EFS: P < 0.0001; OS: P < 0.0001
