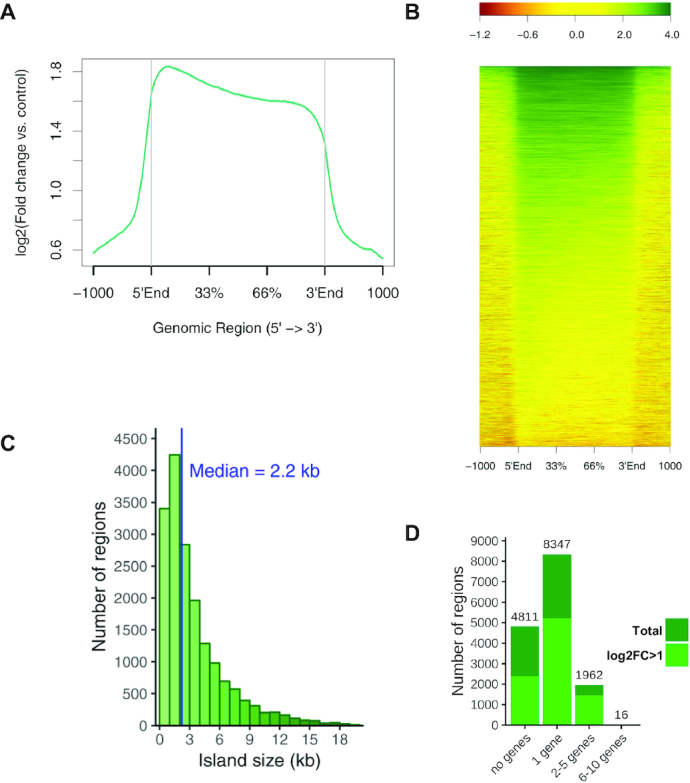
Figure 2:

ChIP-seq analysis of H3K27me3 regions in B. rapa leaves. (A) Metagene plot with the average profile of mean ChIP-seq signal over marked genes. (B) Gene heat map of H3K27me3 marked genes, scaling genes to a same size flanked by 1-kb regions. Color scale indicates the log2 ratios of ChIP samples compared to input. (C and D) Distribution of H3K27me3 peak regions by length (C) and number of covered genes (D). Total and high-confidence (log2FC > 1) H3K27me3 peaks are represented in (D).
