
Figure 5:
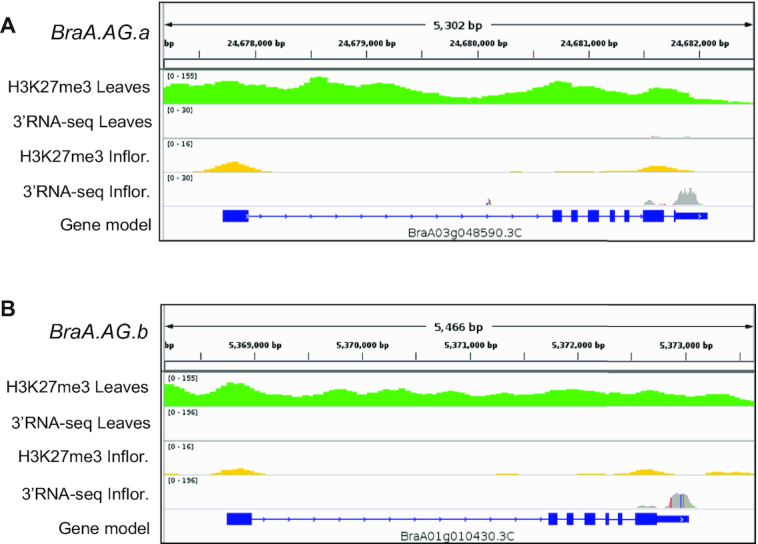
Example of H3K27me3-marked floral regulator loci. IGV viewer snapshots showing the H3K27me3 ChIP-seq and 3′RNA-seq data of BraA.AG.a (A) and BraA.AG.b (B) in B. rapa leaves and inflorescences.
Official websites use .gov
A
.gov website belongs to an official
government organization in the United States.
Secure .gov websites use HTTPS
A lock (
) or https:// means you've safely
connected to the .gov website. Share sensitive
information only on official, secure websites.
Example of H3K27me3-marked floral regulator loci. IGV viewer snapshots showing the H3K27me3 ChIP-seq and 3′RNA-seq data of BraA.AG.a (A) and BraA.AG.b (B) in B. rapa leaves and inflorescences.