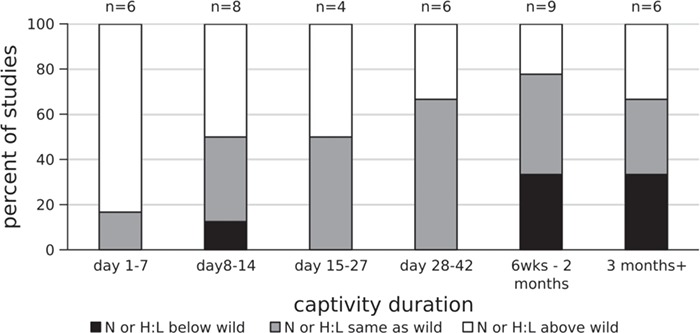
Figure 4.

Changes in neutrophil or heterophil (N or H:L) to lymphocyte ratio in captivity as a function of time. Data were collected from 19 studies listed in Table 4, with studies counted multiple times if they measured multiple time points after introduction to captivity. The percent of studies that recorded elevated N or H:L ratio in captivity decreased with the amount of time spent in captivity.
