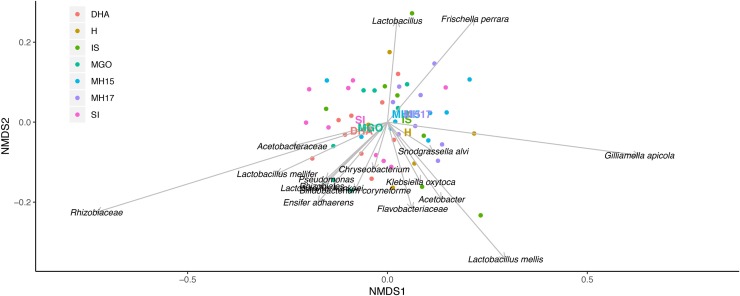
Fig 2.
Nonmetric multidimensional scaling plot of relative abundance of bacteria in the digestive tract of honey bees fed different carbohydrate diets. Total read composition with >0.1% prevalence was included. Honey bees from a single hive were fed one of the following treatments for 6 days: Hive-fed (H), sucrose (S), invert sugar (IS), 2015 mānuka (MH15), 2017 mānuka (MH17), methylglyoxal (MGO), and dihydroxyacetate (DHA). A solution for the plot was reached at stress level 0.273.

