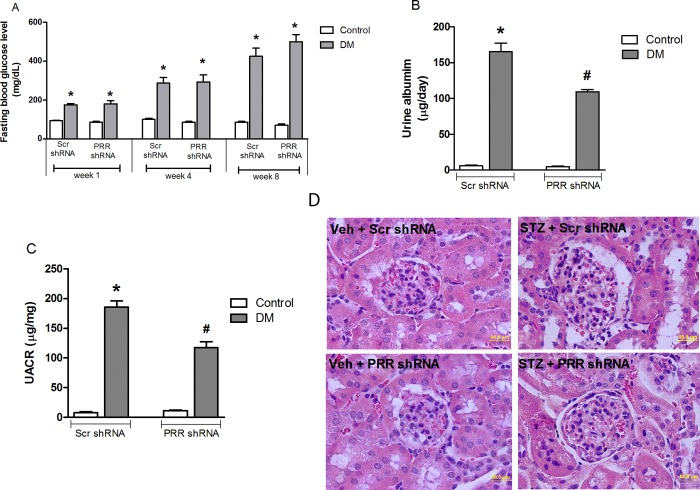
Fig 1. Fasting blood glucose levels in mice at weeks 1, 4 and 8 after diabetes induction.
(A) 24-hour urinary albumin levels in mice (B) and urinary albumin to creatinine ratio (UACR) (C) in mice at the end of study (n = 8, each group). Representative images showing glomerular PAS staining in control and STZ-induced diabetic mice (D) treated with either scramble (Scr) shRNA or PRR shRNA respectively. Data presented as mean ± SEM, *P < 0.05 vs. Veh + Scr shRNA; #P < 0.05 vs. DM + Scr shRNA.

