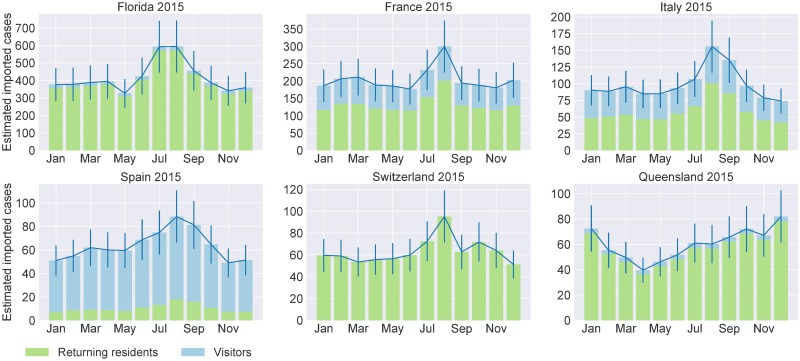
Fig 3. Predicted dengue infections imported by returning residents and visitors in 2015.
Here we show the results for non-endemic countries/states with vector presence with the highest number of predicted imported dengue cases in 2015. The bars are stacked to distinguish between returning residents (green) and visitors (blue). The blue solid line corresponds to the total number of imported cases. The error bars correspond to the model’s coefficient of variation (see Material and methods). The six countries were selected because they are predicted to receive the highest number of dengue importations, are non-endemic and dengue vectors are established.

