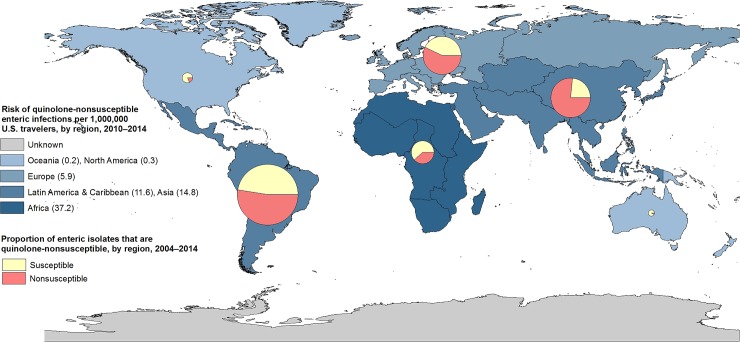
Fig 3. Proportion and risk of quinolone-nonsusceptible enteric infections in US travelers, by region, 2004–2014*.
*Displays, by region, both the risk of quinolone-nonsusceptible enteric infection (differentiated by map shading) and the proportion of enteric isolates that are quinolone-nonsusceptible (presented as pie chart). Size of pie is proportional to the number of isolates tested per region.

