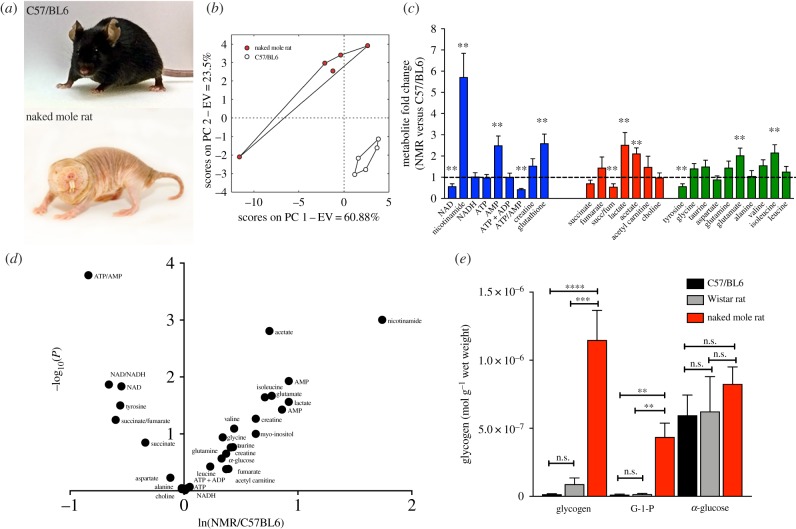
Figure 2.
Cardiac metabolomic profile of naked mole-rats. (a) C57/BL6 mouse and naked mole-rat. (b) Principal component analysis (PCA) of NMR versus C57/BL6 cardiac metabolomic profile showing a good separation between the two groups. (c) 1H nuclear magnetic resonance spectroscopy metabolomic profile presented as fold change NMR versus C57/BL6: redox and energetics (blue bars), TCA cycle, glycolysis and lipid metabolism intermediates (red bars) and amino acid metabolism (green bars). (d) Volcano plot showing ln(NMR/C57/BL6) versus −log10(P). (e) Myocardial concentration of glycogen, glucose-1-phosphate (G-1-P) and α-glucose in C57/BL6, Wistar rat and NMR. n = 5/group. *p < 0.05, **p < 0.01, ***p < 0.001 versus C57/BL6.

