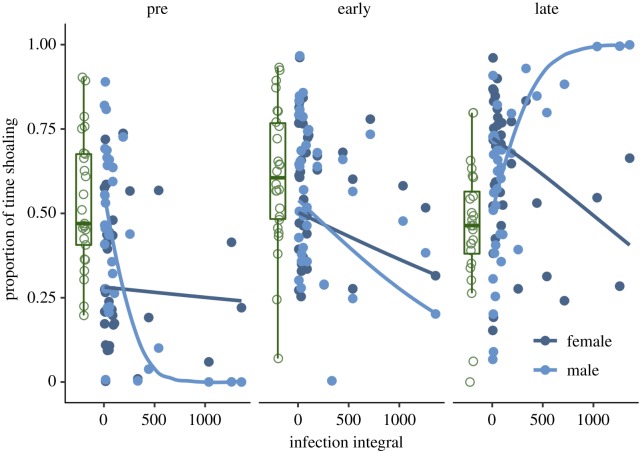
Figure 2.
The proportion of time guppies spent within one body length of the stimulus shoal tank (sociality) depended on a three-way interaction between infection integral (susceptibility), sex and infection stage. Points are partial residuals from the ‘infected only’ model, back-transformed to the response scale and lines give model fits. Box plots give the median (dark line), interquartile range (box) and values within 1.5× the interquartile range (whiskers) of the sham-infected controls; associated open points give the raw data. (Online version in colour.)

