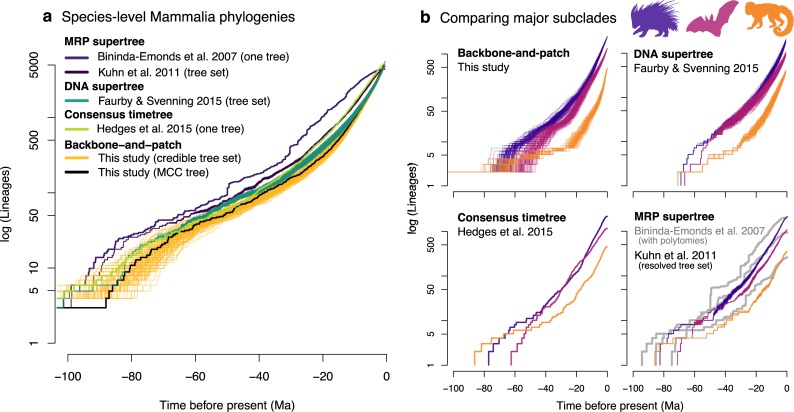
Fig 5. Accumulation of lineages through time for living mammal species as reconstructed in our study versus previous studies.
(a) The shape of Mammalia-wide phylogenies is compared among studies using the natural log of lineage accumulation (see legend colors). Some studies produced one consensus tree (single line), whereas other studies produced sets of 1,000 or 10,000 trees (many lines), in which case 100 trees were randomly sampled. (b) Each of the main species-level Mammalia studies is compared for three major placental orders: Rodentia (purple), Chiroptera (red), and Primates (orange). The degrees of phylogenetic uncertainty present in the tree sets is represented by the width of the lineage accumulation curves. The gray lines in the lower-right-side plot pertain to the MRP supertree with polytomies, whereas the colored lines result from randomly resolving those polytomies into a set of 1,000 trees, of which 100 trees are plotted here. Dryad data: https://doi.org/10.5061/dryad.tb03d03; phylogeny subsets: http://vertlife.org/phylosubsets. Ma, million years ago; MCC, maximum clade credibility; MRP, matrix representation parsimony. Artwork from phylopic.org and open source fonts (see S1 Text, section 9 for detailed credits).

