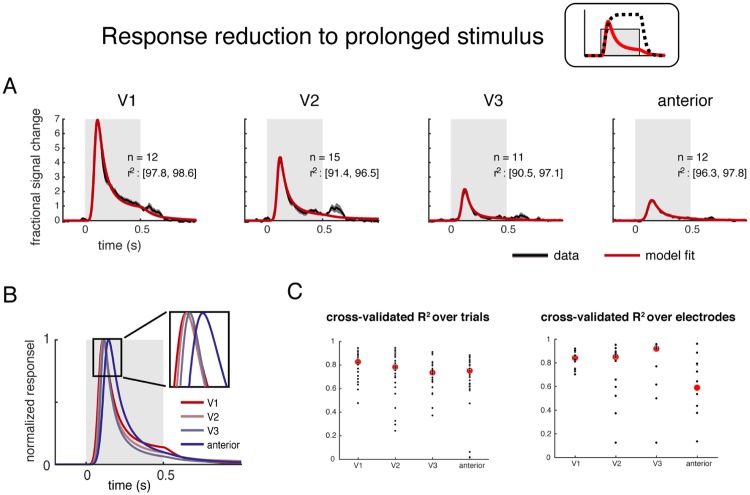
Fig 3. The DN model captures the response reduction for prolonged stimuli at different cortical locations.
(A) The DN model fits (red) accurately describe the ECoG broadband time course (black) in multiple ROIs. Data were averaged across trials and electrodes within ROIs, and models were fit to the average time course. Each trial had a 500-ms stimulus (gray box) followed by a 500-ms blank. Plots show the mean and 50% CI for data (bootstrapped 100 times across electrodes within an ROI), and the model fit averaged across the 100 bootstraps. The number of electrodes per ROI and the 50% CI of model accuracy (r2 per bootstrap) are indicated in each subplot. (B) The model fits for the 4 ROIs are plotted together, scaled to unit height. For this plot, the latency was assumed to be 0 for each ROI, so that the difference in time to peak reflects a difference in integration time rather than a difference in response latency. (C) Cross-validation over trials and over electrodes. 30-fold leave-one-out cross validation over trials was performed on the 30 repeats. Red dots represent the median r2 across trials, and black dots are the leave-one-out prediction to each trial. Leave-one-out cross validation was also performed over electrodes. Details of the cross-validated fit were presented in S3 Fig.

