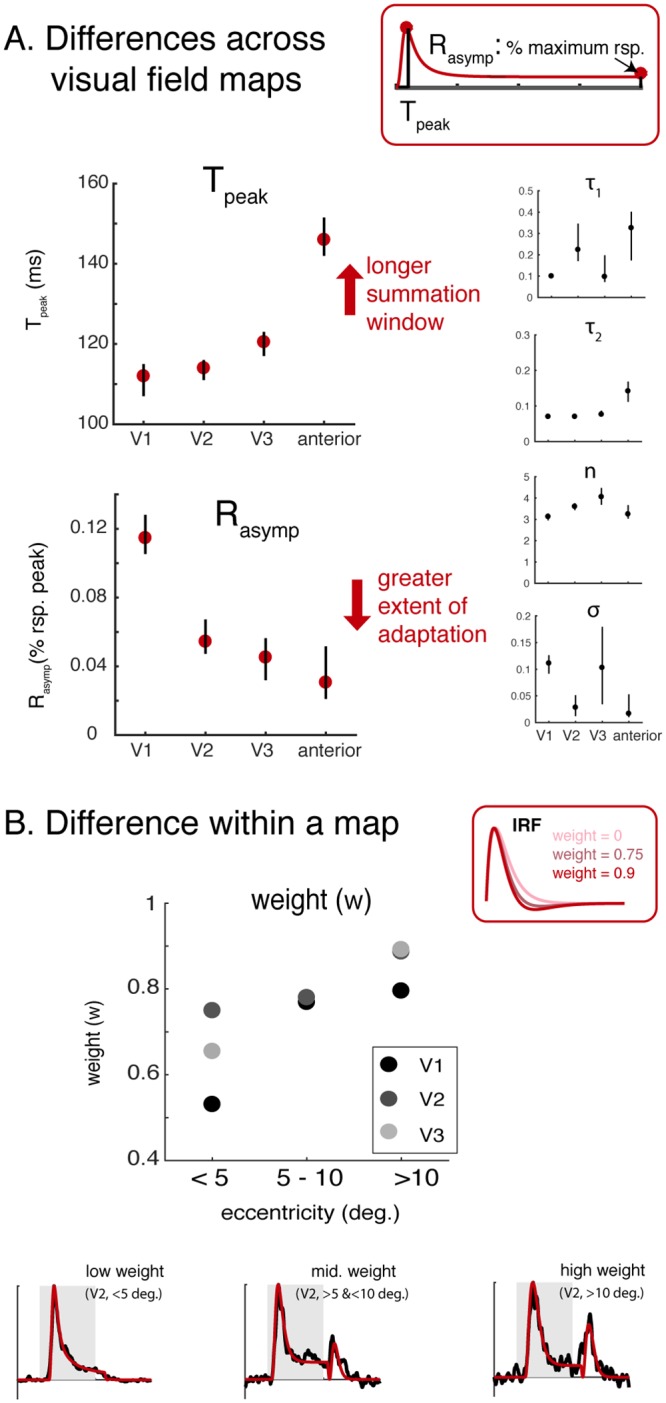
Fig 4. The DN model captures difference of temporal dynamics at different cortical locations.

(A) Temporal summation window length and the extent of gain control increase along the visual hierarchy. The model parameters fit to the data are shown on the right. The model fits were then summarized by two metrics. Tpeak is the duration from the onset of a sustained stimulus to the peak response, excluding the onset latency. Tpeak is longer for later ROIs, ranging from ~115 ms (V1) to ~145 ms (anterior ROIs). Rasymp is the level at which the response asymptotes for a sustained stimulus, as a fraction of the peak response. A smaller Rasymp indicates a greater extent of gain control. Rasymp is largest in V1 (~0.12) and declines in extrastriate areas. See S5 Fig for individual electrode results. (B) Offset response as a function of eccentricity. The lower plots show the time series and model fits to 3 example electrodes. The offset response increases from fovea to periphery. This pattern holds across all 3 ROIs, as shown in the dot plot. Each dot is the mean weight (w) on the negative lobe of the biphasic response. Larger values of w predict larger offset responses.
