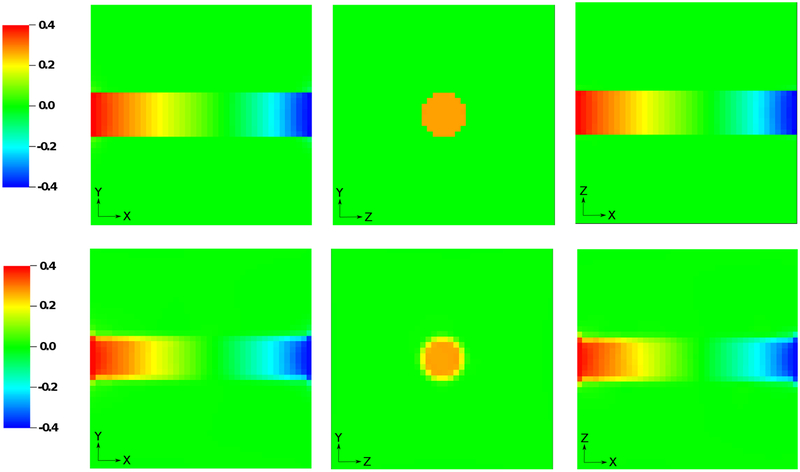
Figure 12:
Comparison of the steady-state pressure field along the planes z = 2.5, y = 2.5, and x = 1 obtained using the present IIM (top panel) and the standard IB method (bottom panel) with a relatively coarse locally refined grid comprising N = 3 levels. With the IB method, spurious pressure oscillations are clearly observed, whereas the interface method yields a sharp pressure profile throughout the computational domain.

