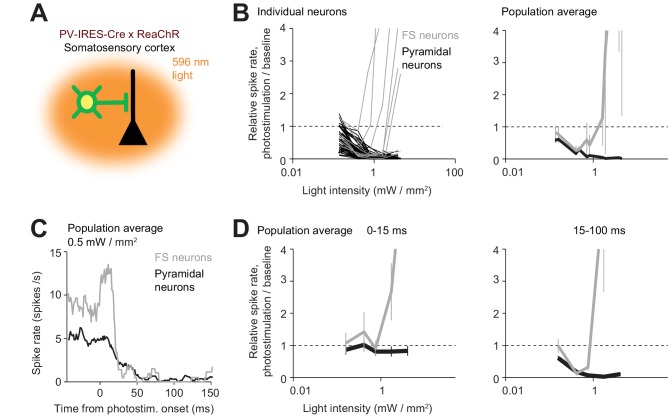
Figure 10. The paradoxical effect.
(A) Photostimulating PV neurons using orange light. Laser beam diameter, 2 mm (Materials and methods). (B) Relative spike rate as a function of light intensity (<0.4 mm from laser center, all cortical depths). FS neurons (gray) and pyramidal neurons (black). Left, individual neurons (lines). Right, mean ± s.e.m. across neurons, bootstrap. Laser power was divided by the illuminated area to obtain light intensity. FS neurons, n = 10, pyramidal neurons n = 82. (C) Mean peristimulus time histogram for FS neurons (gray) and pyramidal neurons (black). (D) Same as (B) but for relative spike rate at different epochs of photostimulation.

