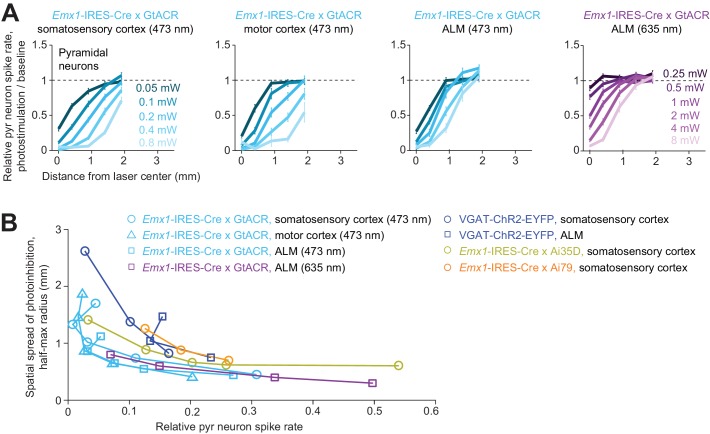
Figure 6. Spatial profile of direct photoinhibition in GtACR reporter mouse.
(A) Relative spike rate versus lateral distance from the photostimulus center for various laser powers. Pyramidal neurons only. Blue light (437 nm) photostimulation in barrel cortex, n = 198; blue light photostimulation in motor cortex, n = 236; blue light photostimulation in ALM, n = 335; red light (635 nm) photostimulation in ALM, n = 236. Neurons were pooled across cortical depths. Mean ± s.e.m., bootstrap across neurons. (B) Photoinhibition strength versus spatial spread. Relative spike rate is the average across all pyramidal neurons near laser center (<0.4 mm, all cortical depths). Spatial spread is the distance at which photoinhibition strength is half of that at the laser center (‘radius, half-max’). Each circle represents data from one photostimulation power. Lines connect all circles of one method. VGAT-ChR2-EYFP, Emx1-IRES-Cre x Ai35D, Emx1-IRES-Cre x Camk2a-tTA x Ai79, data from Figure 5J replotted here for reference.

