
Fig. 1. Mast cells and M2 macrophages are the predominant source of TNF in DD.
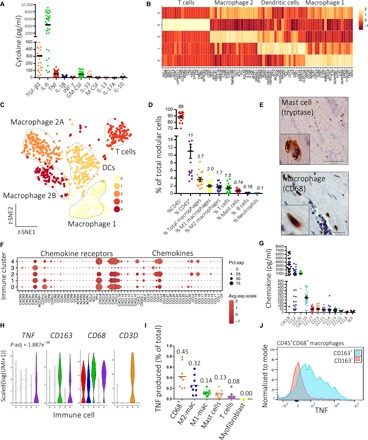
(A) Scatter plot of cytokines secreted by freshly isolated nodular cells in monolayer culture for 24 hours (n = 20 DD patients for TGF-β1 and 40 for all other cytokines; lines represent mean). (B) Heatmap of marker genes of four major immune cell types in single-cell RNA-seq data, displaying average row scaled expression in log(UMI + 1). (C) t-distributed stochastic neighbor embedding (t-SNE) embedding of single-cell RNA-seq of immune cells in Dupuytren’s nodules (n = 12 DD patients, k = 1033 cells). DCs, dendritic cells. (D) Scatter plot of flow cytometry analysis showing percentage of cell types as a proportion of the total population in Dupuytren’s nodules (n = 20 DD patients, line represents mean ± SEM). (E) Representative images of immunohistochemistry for macrophages (CD68) and mast cells (tryptase) in Dupuytren’s nodules. Scale bars, 10 μm. (F) Dot plot mapping genes encoding chemokines and chemokine receptors to immune cell clusters (0 to 4). Expression in scaled(log(UMI + 1)). Pct.exp., percentage of cells in cluster-expressing gene. (G) Scatter plot of chemokines secreted by freshly isolated nodular cells in monolayer culture for 24 hours (n = 40 DD patients; line represents mean). (H) Violin plots showing expression of genes in scaled(log(UMI + 1)) in immune cell clusters. P-adjust denotes adjusted P value (Benjamini-Hochberg correction) for TNF following differential expression analysis (Wilcoxon rank sum test) between macrophage 2B (cluster 4) and all other clusters. (I) Scatter plot of flow cytometry analysis showing TNF expression by nodular cells as a percentage of total TNF produced. Data points are independent DD patients. Lines represent mean (n = 9 DD patients). (J) Representative histograms of flow cytometry analysis showing TNF expression in macrophage populations (n = 5 DD patients).