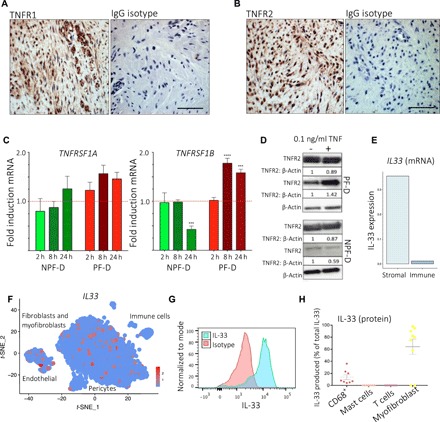
Fig. 2. Stromal cell receptors and immune-mediated cytokine synthesis.

(A and B) Representative images of immunohistochemistry for TNFR1 (A) and TNFR2 (B) expression in Dupuytren’s nodule. Scale bars, 10 μm. IgG is isotype control (rabbit). (C) Bar plots showing TNFRSF1A and TNFRSF1B gene expression by palmar (PF-D) and nonpalmar (NPF-D) dermal fibroblasts from DD patients following stimulation with rTNF (0.1 ng/ml) (n = 3 DD patients, mean ± SEM). (D) Western blot analysis of TNFR1 and TNFR2 protein expression by PF-D and NPF-D from DD patients following stimulation with rTNF (0.1 ng/ml) for 24 hours. (E) Bar plot of IL33 expression (mean normalized counts) in stromal and immune cells in single-cell RNA-seq (n = 6 DD patients, k = 7332 cells). (F) t-SNE embedding of single-cell RNA-seq dataset marking IL33 expression in scaled(log(UMI + 1)). (G) Representative histogram of flow cytometry analysis of freshly isolated nodular cells showing IL-33 expression in CD45− stromal cells with isotype control. (H) Scatter plot of flow cytometry analysis showing IL-33 expression in freshly isolated nodular cells (n = 9 DD patients, mean ± SEM). ***P < 0.001, ****P < 0.0001.
