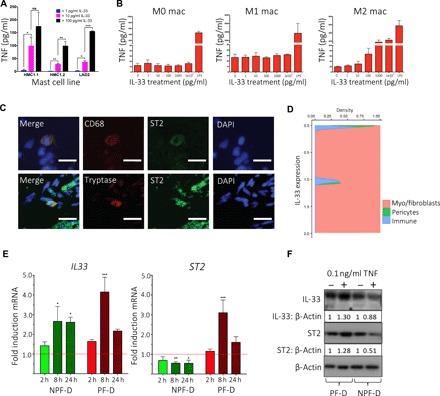
Fig. 3. Stromal–immune cell crosstalk mediated by IL-33 and TNF.

(A) Bar plot of enzyme-linked immunosorbent assay (ELISA) showing TNF secretion in mast cell lines (HMC1.1, HMC1.2, and LAD2) following stimulation with increasing doses of rIL-33 (n = 3, mean ± SEM). (B) Bar plots of ELISA showing TNF secretion by human monocytes and macrophages following stimulation with increasing doses of rIL-33 (n = 3 independent donors, mean ± SEM). (C) Representative confocal images of immunofluorescence for ST2 expression on mast cells (tryptase) and macrophages (CD68) in DD nodules. Scale bars, 10 μm. (D) Conditional density plot of single-cell RNA-seq dataset showing IL33 expression by labeled cell types. Density is Gaussian kernel density estimate (n = 6 DD patients, k = 7332 cells). (E) Bar plots showing IL33 and ST2 gene expression by PF-D and NPF-D dermal fibroblasts from DD patients following stimulation with rTNF at 2, 8, and 24 hours (n = 3 DD patients, mean ± SEM). (F) Western blot analysis showing IL-33 and ST2 protein expression by PF-D and nonpalmar NPF-D dermal fibroblasts from DD patients following stimulation with rTNF(0.1 ng/ml) for 24 hours. *P < 0.05, **P < 0.01, ***P < 0.001. ns, not significant.
