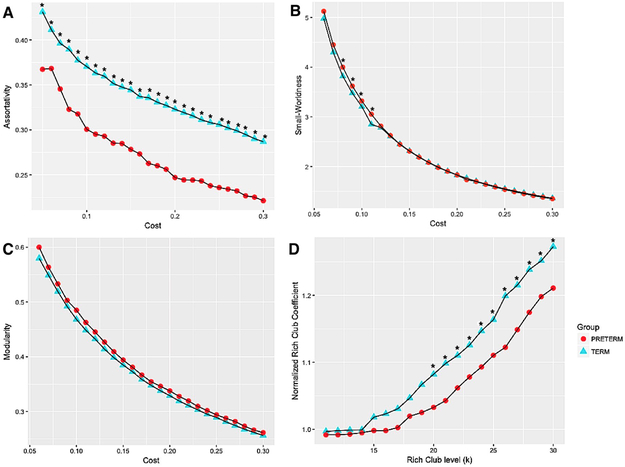
Figure 4:
Comparison of global network measures between preterm and full term born infants plotted as a function of the cost threshold or rich club level (k) used to estimate the parameter: A) Small-Worldness, B) Modularity C) Rich-club Coefficient D) Assortativity. (*) indicates the difference is significant at p<0.05 corrected for multiple comparisons using false discovery rate.

