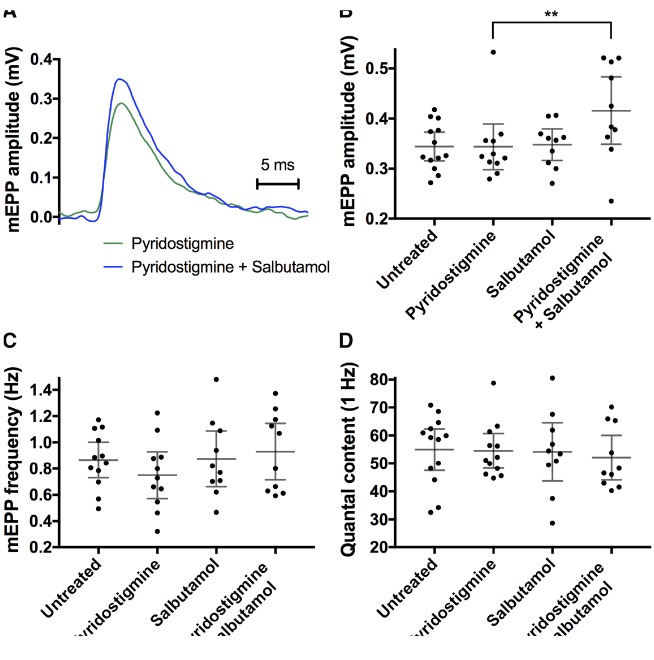
Figure 4.
MEPPs recorded from diaphragm preparations in model mice following the treatment protocol. (A) Example trace of a mEPP of an animal treated with pyridostigmine monotherapy (green) and combination therapy of pyridostigmine and salbutamol (blue) (averaged from ∼30 captured events). (B) MEPP amplitudes; (C) mEPP frequency; (D) quantal content. Dot plots (B–D), with datapoints representing animal means, horizontal lines representing group means and error bars 95% CI (n = 10–13 mice per group; **P < 0.01 obtained from linear mixed model).

