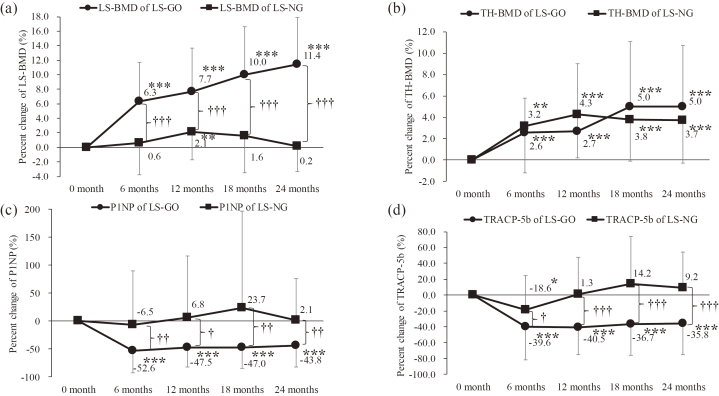
Fig. 2.
Time course comparisons between LS-GO and LS-NG
Time course comparisons for percent change of (a) LS-BMD, (b) TH-BMD, (c) P1NP, and (d) TRACP-5b between LS-GO and LS-NG (n=71). *p<0.05, **p<0.01, and ***p<0.001 using Wilcoxon signed-rank test relative to baseline values. †p<0.05, ††p<0.01, and †††p<0.001 using Mann-Whitney U test between groups at each time point. BMD, bone mineral density; GO, good outcome group; LS, lumbar spine; NG, non-good outcome group; P1NP, N-terminal propeptide of type 1 collagen; TH, total hip; TRACP-5b, tartrate-resistant acid phosphatase-5b.

