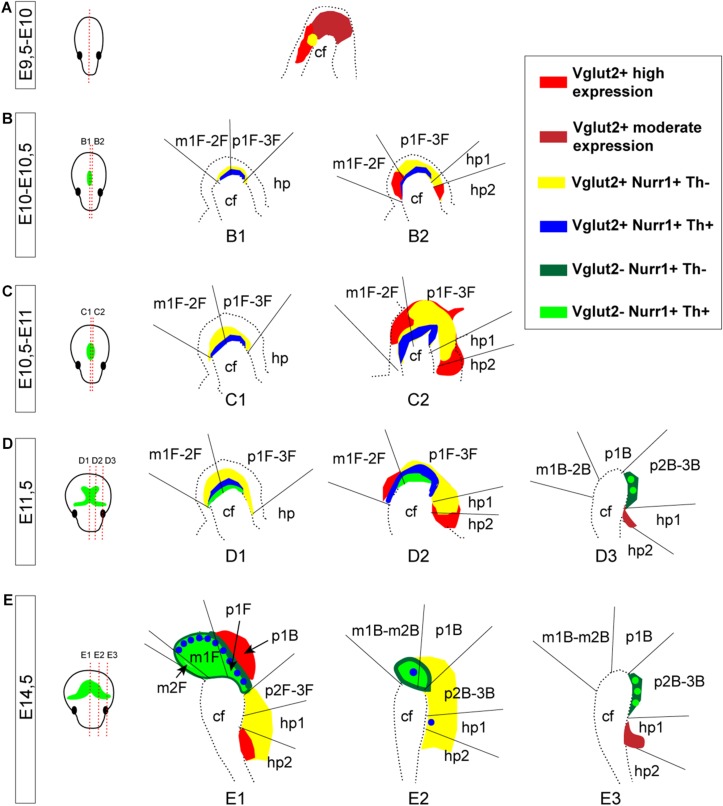
FIGURE 9.
Summary of Vglut2, Nurr1, and Th mRNAs in prosomeric terminology representing different medial-to-lateral section levels of the mes-and di-encephalon at E9.5-E14.5. (A–E) Schematic illustration summarizing Vglut2, Nurr1, and Th mRNAs at each developmental stage analyzed with mRNA overlap represented by different colors, see legend at far right. Note Vglut2 mRNA detection of moderate and high level indicated by different shades of red. Section levels shown in illustration in far left panel (green color illustrate the mDA system, outlined by Th mRNA labeling). Stages: E9.5-10 (A); E10-10.5 (B); E10.5-11 (C); E11.5 (D); and E14.5 (E). Caudal to the left; rostral to the right in each picture. cf, cephalic flexure; hp, hypothalamo-telencephalic prosomer; m, mesomer (mesencephalic prosomer); p, diencephalic prosomer. (B) Refers to basal plate, F refers to floor plate.

