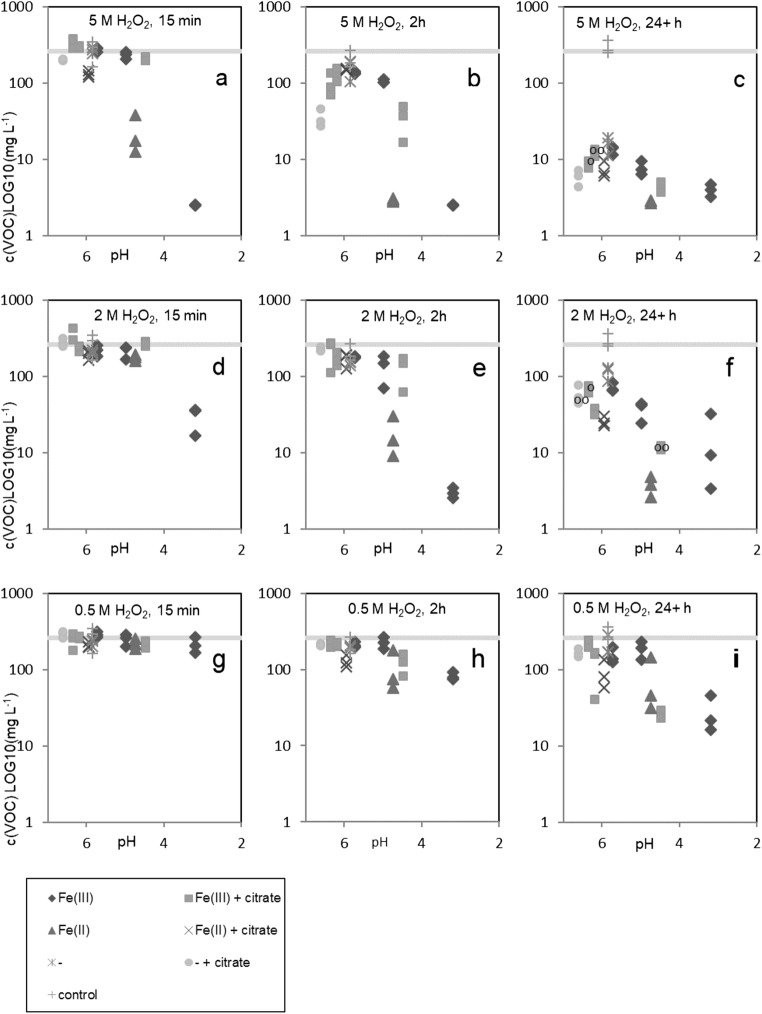
Fig. 1.
a–i VOC concentrations as measured with PID in relation to soil pH after Fe and citrate additions. With H2O2 concentration 0.5 M, 2 M and 5 M at sampling instances 15 min, 2 h and 24+ h. LOG10 transformed y-axis. Grey line indicates original level (average between all treatments, 85 %, confidence interval indicated by the line width) and does not correspond with soil pH. Several treatments appear at different positions on the x-axis because several different concentrations were tested. The group of results marked ‘o’ relate to 48+ h values and the ones marked ‘oo’ to 72+ h values

