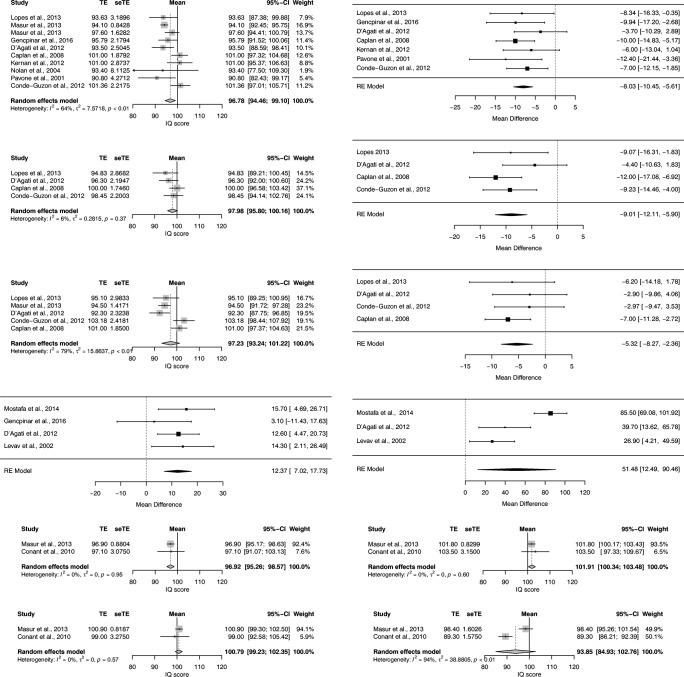
Fig. 2.
Forest plots of the single-arm meta-analyses (weighted average) and meta-analyses of the mean difference (difference in performance in case-control studies). For each study the mean is represented by a square (size is proportional to the study’s weight) and the 95% confidence interval (CI) is represented by a horizontal line. The overall weighted mean is represented by a diamond shape

