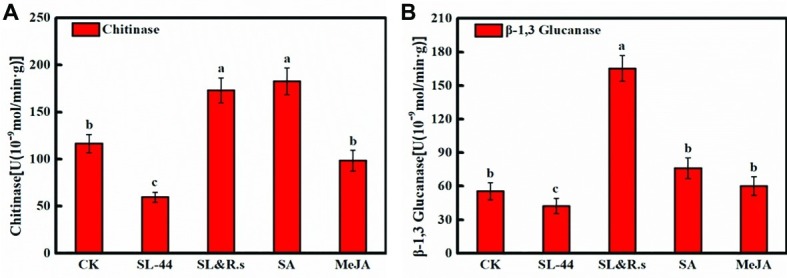
Figure 4.

Chitinase and β-1,3-glucanase of pepper foliage in different treatments of chitinase activity (A) and β-1,3-glucanase activity (B). Each value represents the mean ± SD (n = 6). Different letters above the columns indicate significant differences at p < 0.05.
