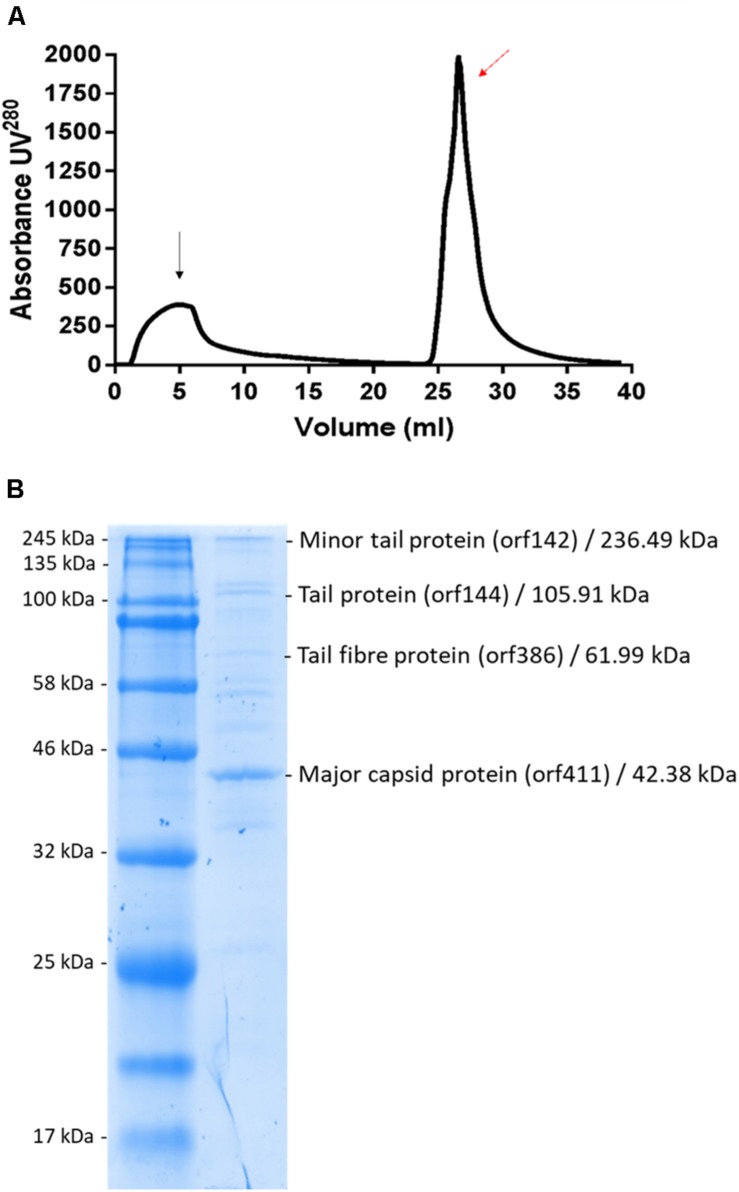
FIGURE 11.
(A) Linear gradient of MIJ3 purification using a DEAE column. The black arrow indicates the flow-through and the red arrow indicates the peak that corresponds with the presence of phage MIJ3. (B) Proteomic analysis of phage MIJ3 particles. Proteins of purified phage particles (B) were separated in 12% (wt/vol) polyacrylamide gel by SDS-PAGE and stained with Coomassie brilliant blue. The protein bands were subjected to LC–MS/MS analysis. On the right are the descriptions of the genes, their deduced molecular sizes based on the ORF sequences, and their possible functions. Positions of size markers are shown on the left (A).

