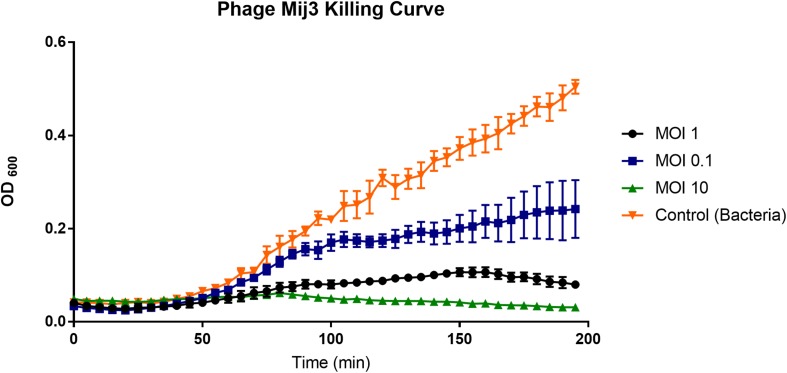
FIGURE 3.
A graph showing the ability of phage MIJ3 to lyse P. aeruginosa PAO1 at different multiplicity of infections (0.1, 1, and 10) in LB medium at 37°C. At a high phage titer (MOI 10), bacterial growth was inhibited because of the phage infection (green). When an equal ratio of phage/bacteria was used (MOI 1), bacterial growth showed a slight increase after 90 min (black). At lower phage titer (MOI 0.1), bacteria were growing at higher levels but less than the non-infected cells (blue). The non-infected sample was used as a control (orange). Each experiment was done in triplicate, and OD600 values were measured, averaged, and plotted. Error bars represent SEM for three replicates.

