Fig. 4.
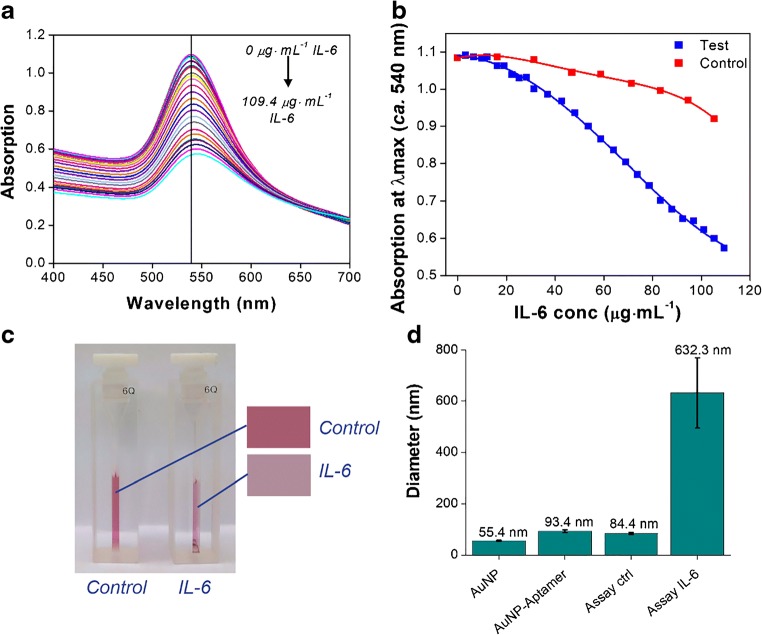
Aggregation assay (comprising of 50 nm mixed-aptamer-AuNP) results for IL-6 standard in buffer. Decreasing absorption intensity at the λmax (ca. 540 nm) in response to increasing concentrations of IL-6: UV-Vis absorption spectra (a), and absorption at λmax comparison with buffer control (b). The visible colour change of the final test solution (containing 109.4 μg·mL−1 IL-6) compared with the control sample containing an equivalent volume of blank buffer (c). Results shown in a, b and c are from a single experiment, representative of all repeats (n = 2). Aptamer-AuNP concentration prior to IL-6 addition is estimated at 0.05 nM. Characterisation of the cAuNP core, aptamer-AuNP, test control, and the test solution (containing 109.4 μg·mL−1 IL-6) by DLS (d). The size estimates shown are based on 10 repeat measurements (n = 2 separate experiments); error bars denote SD of repeat measurements

