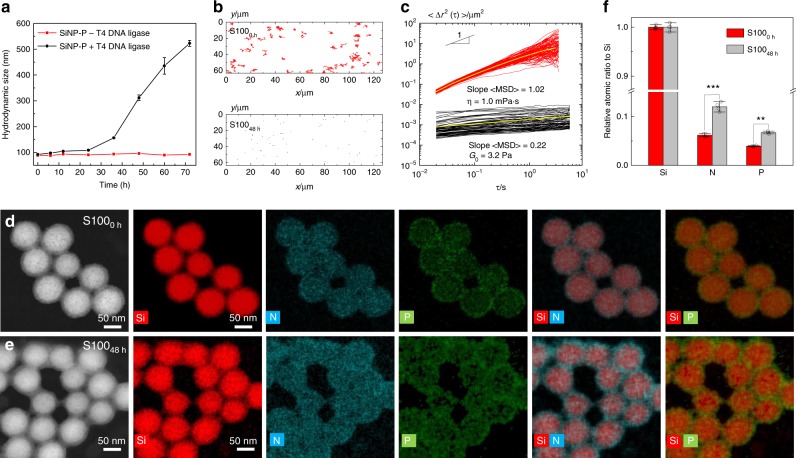
Fig. 3. Characterization of SiNP-DNA nanocomposites.
a Hydrodynamic size of products produced from RCA on SiNP-primer-template (SiNP-P-T) particles in the presence or absence of T4 DNA ligase. All data are represented by mean ± S.D. of triplicate samples. b Trajectory maps and c MSD values of tracer particles in S100 after 0 and 48 h of RCA. The yellow curves in c represent the average MSD. d, e Representative HAADF-STEM imaging (first column), EDS elemental mapping (second to sixth column) and f relative atomic ratios of N and P to Si of S100 after 0 and 48 h of RCA. Data represent mean ± S.D. of the EDS measurements determined from 50 particles in four random areas.

