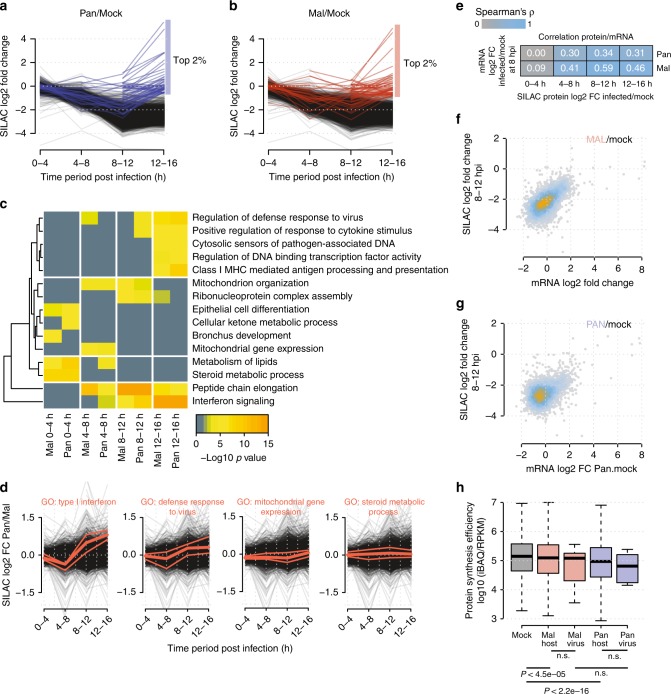
Fig. 2. The dynamic host proteome of IAV-infected cells.
a, b SILAC profiles of host proteins infected with Pan (a) or Mal (b) compared to mock infection. The top 2% of proteins that are strongest produced during the last time period are highlighted. c Functional protein clusters least affected by host shutoff were identified. The 2% proteins with the highest ratios were selected for each time period and multi-list GO enrichment was performed. d Median, 25th, and 75th percentile of proteins related to a selected set of GO terms are highlighted in the direct SILAC comparison Pan/Mal. All other protein profiles in black. e Spearman’s rank correlation coefficients when comparing the indicated RNA and protein level data. f, g Scatterplot of mRNA changes vs. protein synthesis level changes in Pan/mock or Mal/mock infection conditions. Blue and orange coloring of data points reflects the density of data points. h Protein synthesis efficiencies calculated from absolute mRNA (RPKM, 8 hpi) and protein data (iBAQ, 8–12 hpi) (center line, median; box limits, upper and lower quartiles; whiskers, 1.5× interquartile range, outliers (data points outside the whiskers) were removed for visibility). For the assessment of statistical significance two-sided Wilcoxon’s rank-sum tests were performed and p values are given (ns: non-significant). All data are based on the mean of n = 2 biological replicates.

