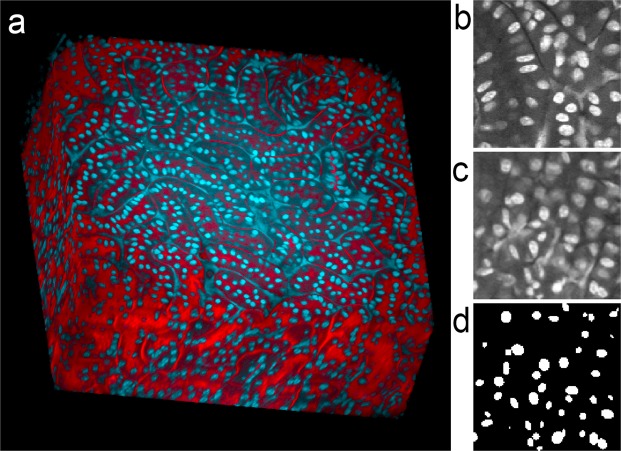
Figure 3.
Three-dimensional image collected from cleared kidney sample with non-specific fluorescence. (a) Volume rendering of rat kidney tissue following clearing. Red – TexasRed-phalloidin, Blue – Hoechst 33342-labeled nuclei. A movie of the volume rendering is shown in Supplementary Video 5. (b) Single plane image from a subvolume of the image of nuclei that was used to derive the synthetic image volume. (c) Single plane image from the synthetic image volume obtained from volume shown in panel B. (d) Binary segmentation of the focal plane shown in panel c. Image volume shown in panel A is 512 microns across and 200 microns deep. Panels b, c and d represent an image field that is 64 microns across.

