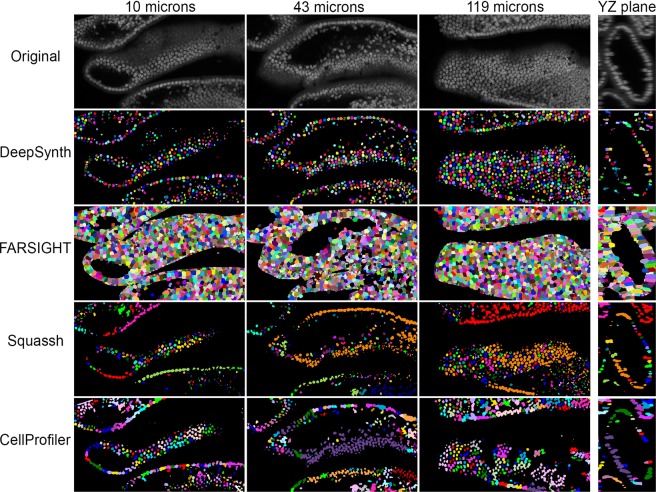
Figure 7.
Mouse intestine - comparison of segmentations obtained from DeepSynth with those obtained using software commonly used in biomedical imaging. Images collected from different depths of the volume of nuclei collected from mouse intestine tissue are shown in the top row. Segmentation results obtained using DeepSynth, FARSIGHT, Squassh and CellProfiler are shown in the rows below. Individual objects are rendered in different colors to facilitate evaluation of discrimination of individual nuclei. Each panel is collected from a region of the sample that is 242 microns wide. Supplementary Videos 13, 14 and 15 show animations of volume renderings of segmentations obtained using DeepSynth with those obtained using FARSIGHT, Squassh and CellProfiler, respectively, for a subvolume ranging from 19 to 44 microns depth in the sample.

