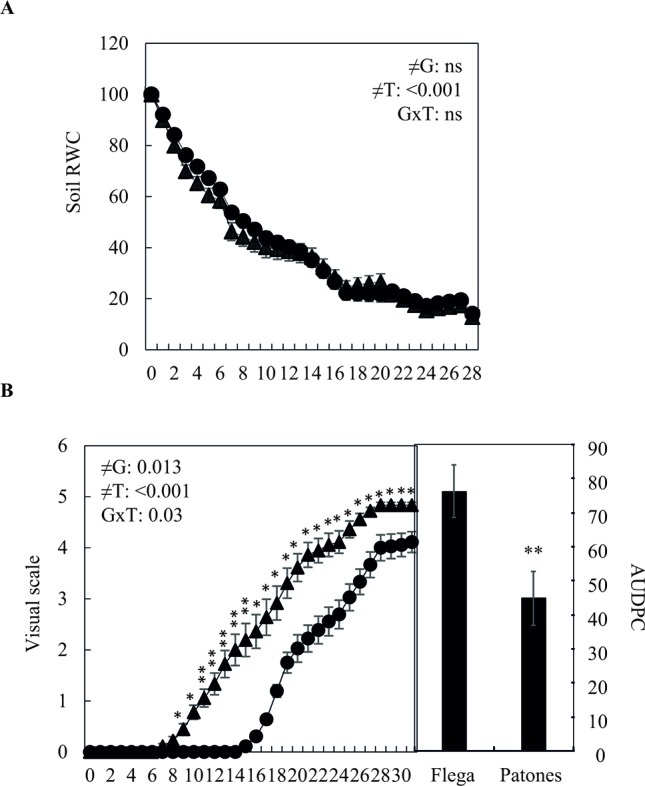
Figure 6.

Effect of water deficit on oat adult plants grown under climatic field conditions (A) Soil relative water content and (B) Drought symptoms of Flega and Patones adult plants during a drought time course. Data are expressed as percentage respect to control plants growing in well-watered conditions and are mean of eight biological replicates ± standard error. ≠G, ≠T and G × T indicate statistical significance for the time course between genotypes (G), sampling times (T) and their interaction, respectively. AUDPC indicate the cumulative values of the area under the drought symptom progress curve. *, **, indicate significant differences at P < 0.05, and 0.01, respectively, ns indicates non-significant differences.
