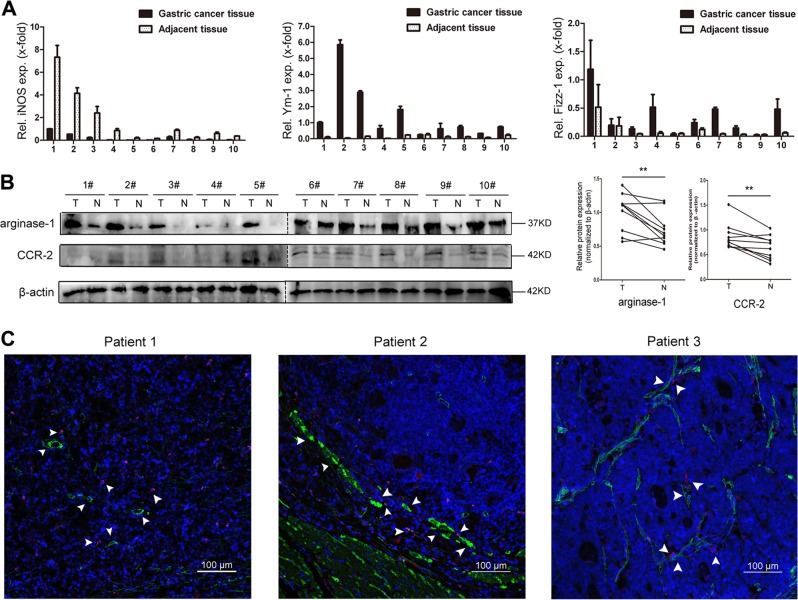
Fig. 2. M2 macrophage-related protein expression and the co-location of M2-macrophages and GC-MSCs within tumor tissues.
a Expression levels of iNOS, Ym-1, and Fizz-1 mRNA were analyzed by RT-qPCR in tumor tissues and the corresponding adjacent non-cancerous tissues collected randomly from 10 gastric cancer patients. b The expressions of arginase-1 and CCR-2 were assessed by western blot in tumor tissues and the corresponding adjacent non-cancerous tissues collected randomly from 10 gastric cancer patients. c Representative immumofluoresence images of the co-location of GC-MSCs (α-SMA; green) and M2-macrophages (CD204; red) in gastric cancer tissues detected by confocal microscopy. scale bar, 100 µm. **P < 0.01 vs. gastric cancer tissue. T: tumor; N: non-cancerous tissues.

