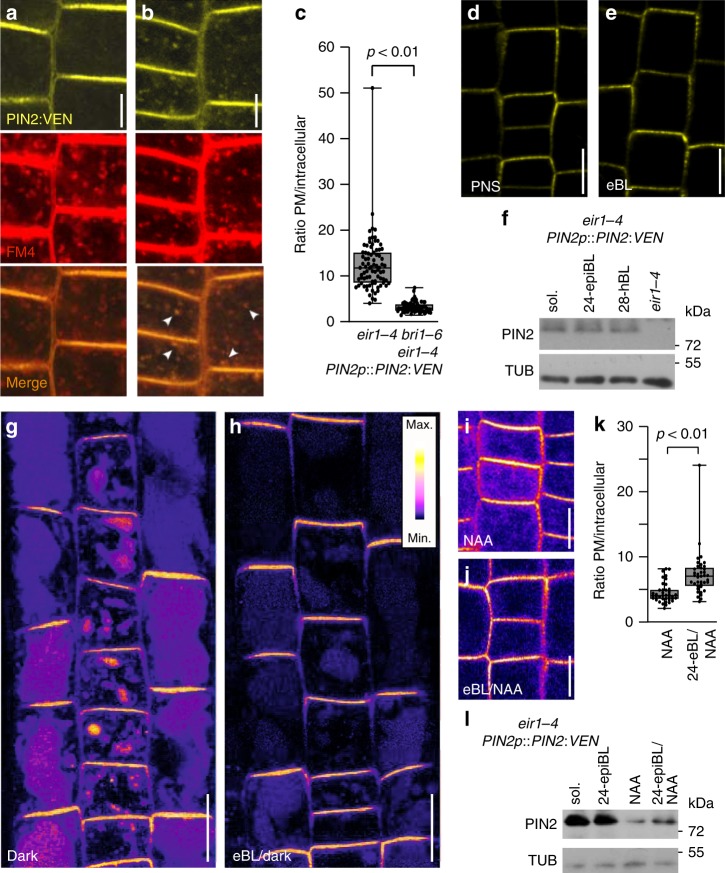
Fig. 4. Sorting of tagged wild type PIN2 is modulated by brassinolide.
a, b Top panels: PIN2:VEN distribution in 6 DAG day-old eir1-4 PIN2p::PIN2:VEN (a) and bri1-6 eir1-4 PIN2p::PIN2:VEN (b) root meristem epidermis cells. Middle panels FM4-64 distribution after 20 min of treatment (FM4). Bottom panels: Merged images. White arrowheads: co-localization in endocytic vesicles. c PIN2:VEN signal ratio between PM and endosomal vesicles in eir1-4 PIN2p::PIN2:VEN and bri1-6 eir1-4 PIN2p::PIN2:VEN root meristem epidermis cells (n = 8 roots and 82/72 cells/dataset). Two-tailed t-test analysis of resulting values revealed a significant difference. d, e PIN2:VEN in 6 DAG eir1-4 PIN2p::PIN2:VEN root epidermis cells in mock-treated samples PNS (d) or with 100 nM eBL for 16 h (e). f Western blots performed with eir1-4 PIN2p::PIN2:VEN root membrane protein fraction grown on PNS or treated with 100 nM eBL or 28-homoBL for 16 h. Membrane protein extract from eir1-4 served as control. g, h Heat map of eir1-4 PIN2p::PIN2:mCherry root meristem epidermis cells at 6 DAG, seedlings were grown with roots in the dark, either on control medium (g) or treated with 100 nM eBL for 3 h (h). i, j Heat map of PIN2:VEN distribution in epidermis cells of 6 DAG eir1-4 PIN2p::PIN2:VEN, treated with 10 μM NAA for five hours (i) or pre-treated with 100 nM for 16 h before NAA treatment (j). k Box plot, displaying PIN2:VEN signal distribution after NAA and eBL/NAA treatments (see ‘i, j’; n = 5 roots and 39 cells/dataset). l Western blots performed with eir1-4 PIN2p::PIN2:VEN root membrane protein fraction treated with 10 μM NAA for 5 h (NAA) or pre-treated with 100 nM eBL for 16 h before NAA treatment (24-epiBL/NAA). Material from mock-treated (sol.) and eBL-treated seedlings (24-epiBL), served as controls. Anti-α-tubulin (TUB) was used as loading control. Whiskers in box plots represent the entire range of outliers; gray boxes: first and third quartiles; center line: median; dots: values obtained. Two-tailed t-test analysis has been performed to test for p-values. Scale bars: a, b = 5 μm; d, e, g–j = 10 μm. Source data are provided as Source Data file.

