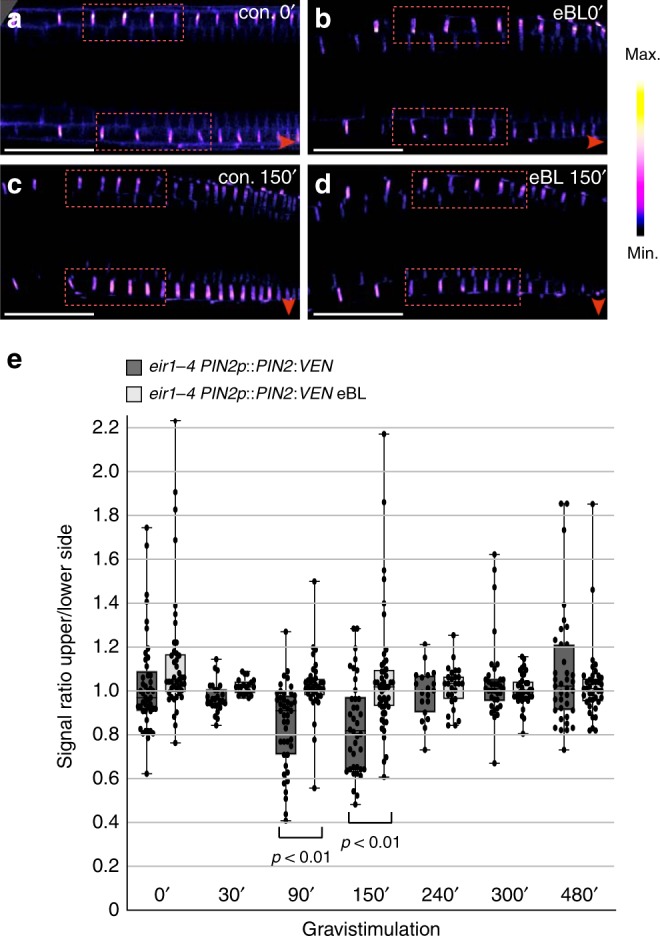
Fig. 6. PIN2 expression in gravistimulated roots is controlled by brassinolide.

a–d Stacks of z-sections generated for analysis of PIN2:VEN signal distribution (see ‘e’), at time point zero (a, b) and after 150 min of gravistimulation (c, d). Relative signal intensities were determined measuring signals in adjacent root epidermis cells in the bending zone (highlighted by dotted red rectangles). Red arrowheads: direction of gravity vector. e PIN2:VEN signal ratios in epidermis cells at upper vs. lower side of gravistimulated root meristems. 19–47 roots were analyzed for each dataset. One-way ANOVA with post-hoc Tukey HSD test revealed significant differences between control roots on PNS and roots pre-treated with 100 nM eBL, after 90 and 150 min of gravistimulation. Whiskers in box plots cover the entire range of outliers obtained in the datasets; gray boxes display first and third quartiles; center line: median; dots: values obtained. Scale bars: a, b = 50 μm. Source data are provided as Source Data file.
