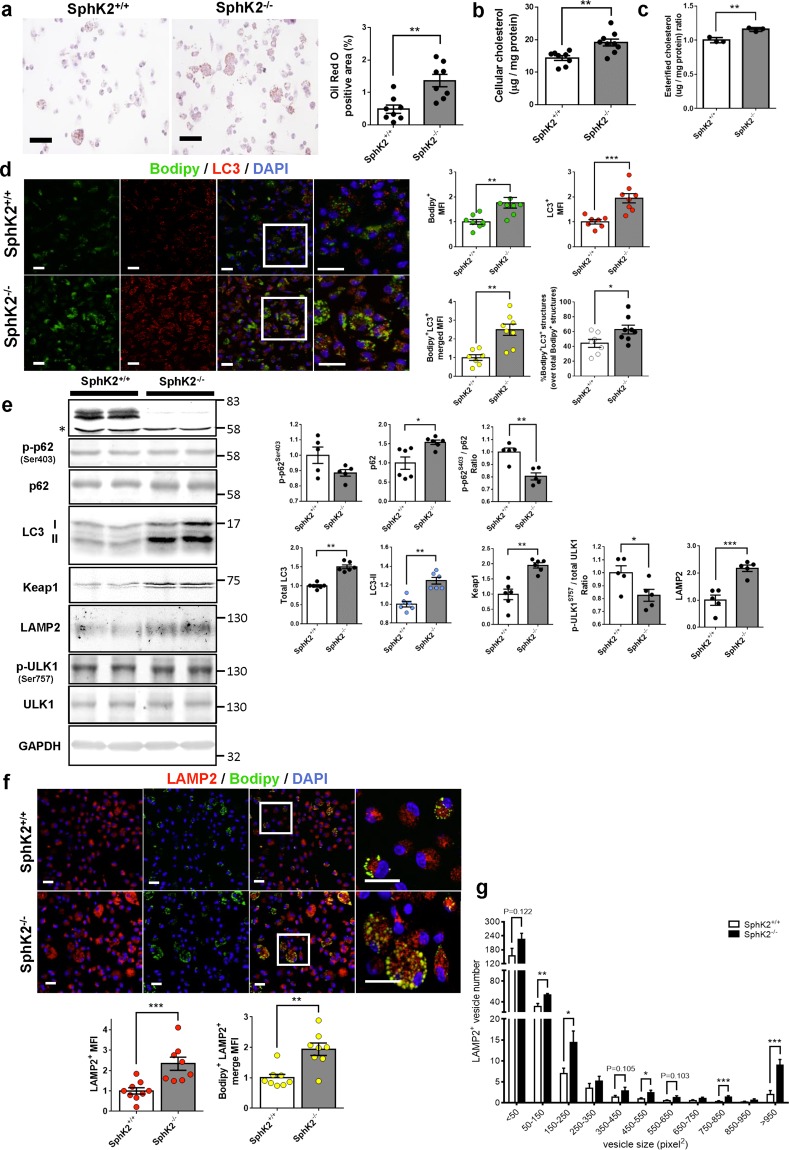
Figure 3.
Increased cholesterol accumulation and impaired autophagy in SphK2−/− macrophages. Peritoneal macrophages were freshly harvested from SphK2+/+ and SphK2−/− male mice after 2 weeks of WD feeding. (a) Lipid deposition in ORO-stained SphK2+/+ and SphK2−/− macrophages (n = 4 per group). Representative images (left). Scale bars, 50 μm. Quantified data of ORO-stained areas (n = 4 per group) (right). (b) The total cholesterol content of peritoneal macrophages from SphK2+/+ and SphK2−/− male mice (n = 8–9 per group). (c) The esterified cholesterol content of peritoneal macrophage from SphK2+/+ and SphK2−/− male mice (n = 3 per group). The data are expressed as a relative value to that of SphK2+/+ macrophages. (d) Lipid deposition in LC3-positive structures in macrophages from SphK2+/+ and SphK2−/− male mice (n = 9–10 per group). Representative images (top). Scale bars, 20 μm. MFI of Bodipy- and anti-LC3 signals (bottom). Scale bars, 20 μm. (e) Immunoblot analysis of the autophagy-related protein expression in peritoneal macrophages from SphK2+/+ and SphK2−/− male mice. Representative blots (left). *Non-specific band. The levels of these proteins were normalized to those of GAPDH (n = 5–6 per group) (right). (f) Lipid deposition in LAMP2-positive structures in macrophages from SphK2+/+ and SphK2−/− male mice (n = 9–10 per group). Representative images (top). Scale bars, 20 μm. MFI of anti-LAMP2 signals, as well as Bodipy- and anti-LAMP2 double signals (bottom). (g) Histogram analysis of the sizes of LAMP2+ vesicles in macrophages. *P < 0.05, **P < 0.01 and ***P < 0.001.

