Fig. 4.

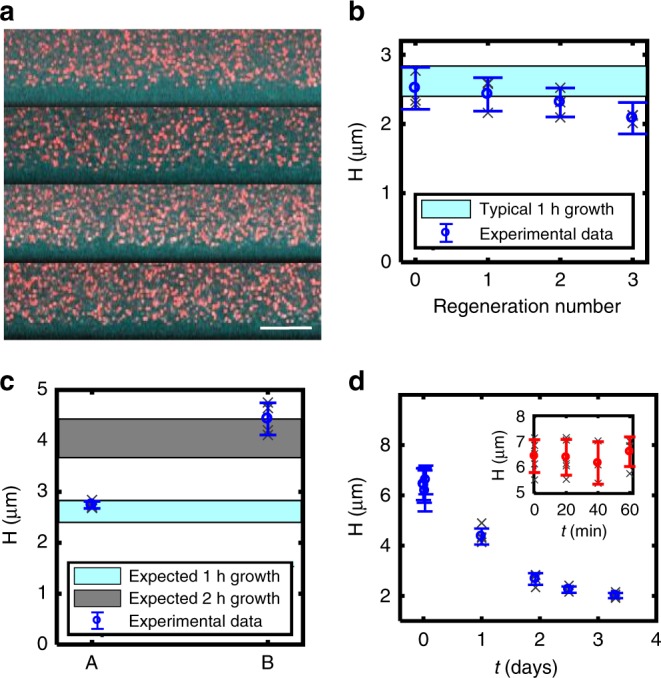
Brush regeneration and patterning. a Regeneration of HA brush after enzymatic degradation with hyaluronidase. Top image shows brush after 1 h of growth before digestion. The next three images show the regenerated brush following digestion and 1 h regrowth 1, 2, and 3 times. b Brush height versus the number of regeneration times (N = 3 brushes, where gray x’s correspond to average of five measurements of each brush and blue is the mean and st dev). c Interrupted growth (A) followed by an additional growth period of 1 h (B). (Gray x’s correspond to five measurements from one sample.) d Brush stability versus time (unreinforced, natural brush), For both c, d, N = 1 brush, gray x’s correspond to measurements on same brush, blue reports the mean and st. dev.
