Fig. 6.
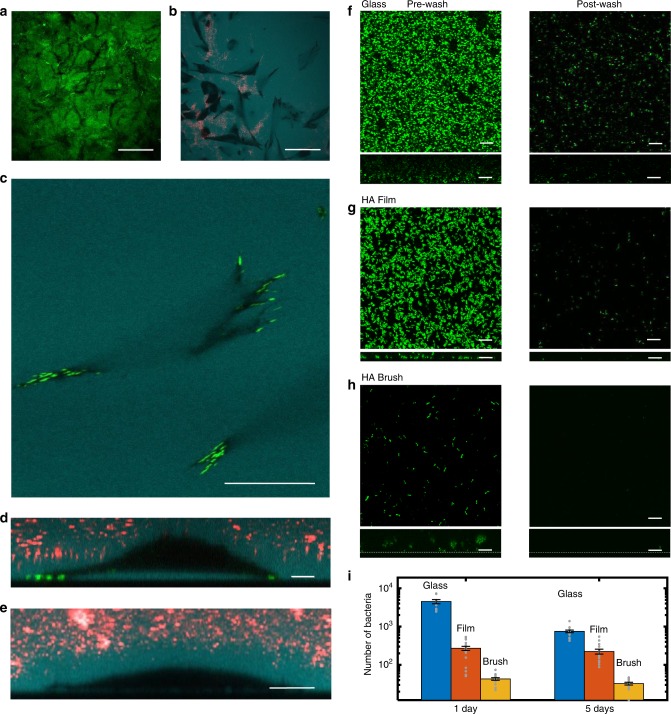
Fibroblast and biofilm interactions with HA brush. a Black tracks in the GFPn-labeled HA brush reveal areas of brush digestion by MEF cells. Scale bar 50 µm. b Fluorescent dextran (cyan) highlights space under adherent cells (to the brush). Black regions correspond to cell area in close contact with surface. Red fluorescent particles fill areas of brush elimination due to digestion by cells. Scale bar 50 µm. c Fibroblasts attach to the interface underlying the HA brush, expressing mature focal adhesions (green, vinculin). Dextran is apparent underneath the spread cell. Scale bar 20 µm. d z-slice of the same adherent fibroblast from (c) sitting on a cushion of HA. Scale bar 10 µm. e Particle exclusion assay reveals MEFs express a thick glycocalyx. All MEF images were taken after 12 h exposure to the HA reinforced brush. Scale bar 10 µm. f−h Confocal micrographs of GFP-producing Pseudomonas aeruginosa (PAO1) interacting with a glass interface (f), an HA film (g), and a reinforced HA brush (h). All images were taken at the glass interface. Left: biofilm growth before washing (1 day). Right: biofilm growth after washing (1 day). Dextran was used to identify the glass interface beneath the brush. XZ side views of the biofilms are presented below each respective XY top view of the samples. Scale bars, 10 µm in (f−h). i Comparison of the number of bacteria retained after washing different surfaces. Data were taken in triplicates and averaged over five regions per sample. Error is SEM. Data are available in Table 3 in the Supplementary Information.

