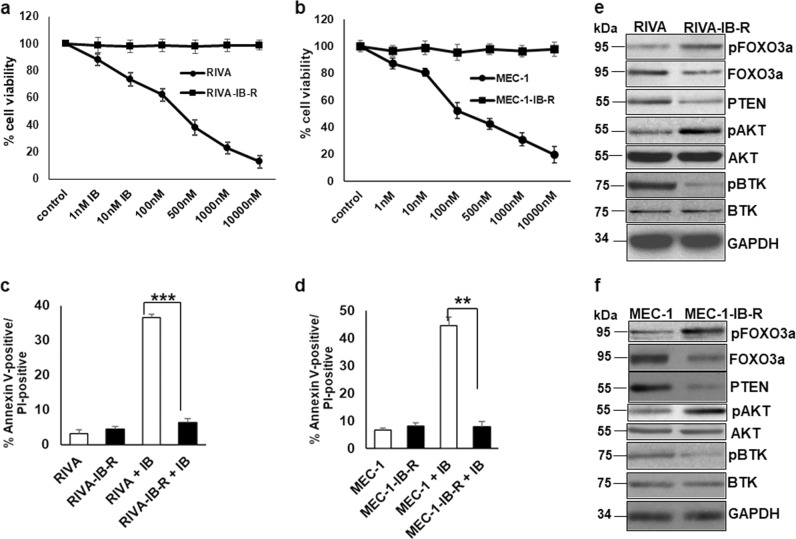
Fig. 1. Acquired resistance to ibrutinib leads to decreased FOXO3a and PTEN levels and activation of AKT.
a, b RIVA and MEC-1 cells were treated with the indicated concentrations of ibrutinib for 72 h and cell viability was determined by the MTS assay. Control cells were treated with DMSO. c, d Cell death analysis in parental (RIVA, MEC-1) and ibrutinib-resistant derivatives (RIVA-IB-R, MEC-1IB-R) in response to 24 h ibrutinib treatment determined by Annexin-V/PI staining. All data are expressed as mean ± S.D. of percentage of cell death. Standard deviation (SD) is indicated as error bars (N = 3). (*p < 0.05, **p < 0.01, ***p < 0.001). e, f Expression levels of pFOXO3aSer253, FOXO3a, pAKTSer473, AKT and PTEN in whole cell extracts of untreated parental and IB-R RIVA and MEC-1 cell lines. GAPDH was used as a loading control.

