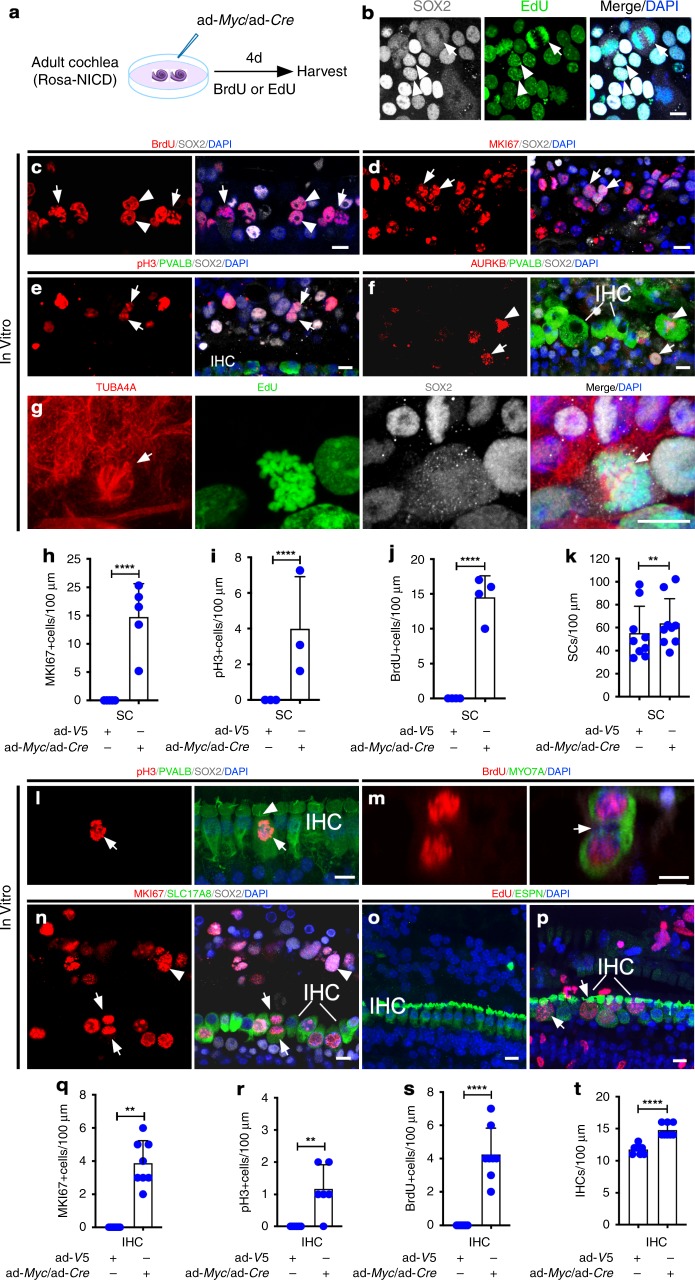
Fig. 2.
Characterization of proliferation in adult cochlea. a A diagram illustrating the experimental procedure. b–f Four days post ad-Myc/ad-Cre infection of the Rosa-NICD adult (6-week-old) cochlear explant in vitro, SC mitotic figures (b, c, arrows), dividing SC nuclear doublet (b, c, arrowheads), MKI67+ (Ki67+) SCs (d, arrows) were seen. pH3+ SCs (e, arrows), AURBK+ SCs (f, arrow) and AURBK+ IHCs (f, arrowhead) were detected. g Alpha-tubulin labeled dividing SCs (TUBA4A+/ SOX2+/EdU+) in vitro, with the arrow showing TUBA4A+ spindle microtubules. h–k Quantification showed an increase in the SCs labeled with MKI67 (h), pH3 (i) and BrdU (j), as well as the total number of SCs (k) in ad-Myc/ad-Cre-infected compared to control ad-V5-infected Rosa-NICD cochleae. **p < 0.01, ****p < 0.0001, two-tailed unpaired (h–j) and paired (k) Student’s t-tests. Error bar, mean ± s.d.; h: n = 5; i: n = 4; j: n = 3; k: n = 9. l–n Four (l) and six (m, n) days after ad-Myc/ad-Cre injection into adult Rosa-NICD mouse cochlea in vivo, a pH3+ IHC (l, arrow; arrowhead points to hair bundles), a dividing IHC (m) with the arrow pointing to the cleavage site between two daughter cells, and MKI67+ IHCs (n, SLC17A8+/MKI67+, arrows point to a pair of IHC doublets) and SCs (n, SOX2+/MKI67+, arrowhead) were detected. o, p Compared to a control ad-V5-injected Rosa-NICD adult cochlea without proliferation (o), the ad-Myc/ad-Cre injected Rosa-NICD cochlea showed IHC proliferation with enlarged cell bodies (p, arrows show EdU+ IHC with enlarged bodies), 12 days after injection. q, r Quantification showed increase in MKI67+ IHCs (q) and pH3+ IHCs (r) in adult Rosa-NICD cochleae injected with ad-Myc/ad-Cre or ad-V5 for 4 days, respectively. **p < 0.01, two-tailed unpaired Student’s t-test. Error bar, mean ± s.d.; n = 8 for each group in (q); n = 6 for each group in (r). s, t Quantification showed increase in BrdU+ IHCs (s) and the total number of IHCs (t) in adult Rosa-NICD cochleae injected with ad-Myc/ad-Cre and ad-V5 in vivo at six days. ****p < 0.0001, two-tailed unpaired Student’s t-test. Error bar, mean ± s.d.; n = 8 for each group in (s, t). n is the number of biologically independent samples. Scale bars: 10 μm. Source data are provided as a Source Data file.

