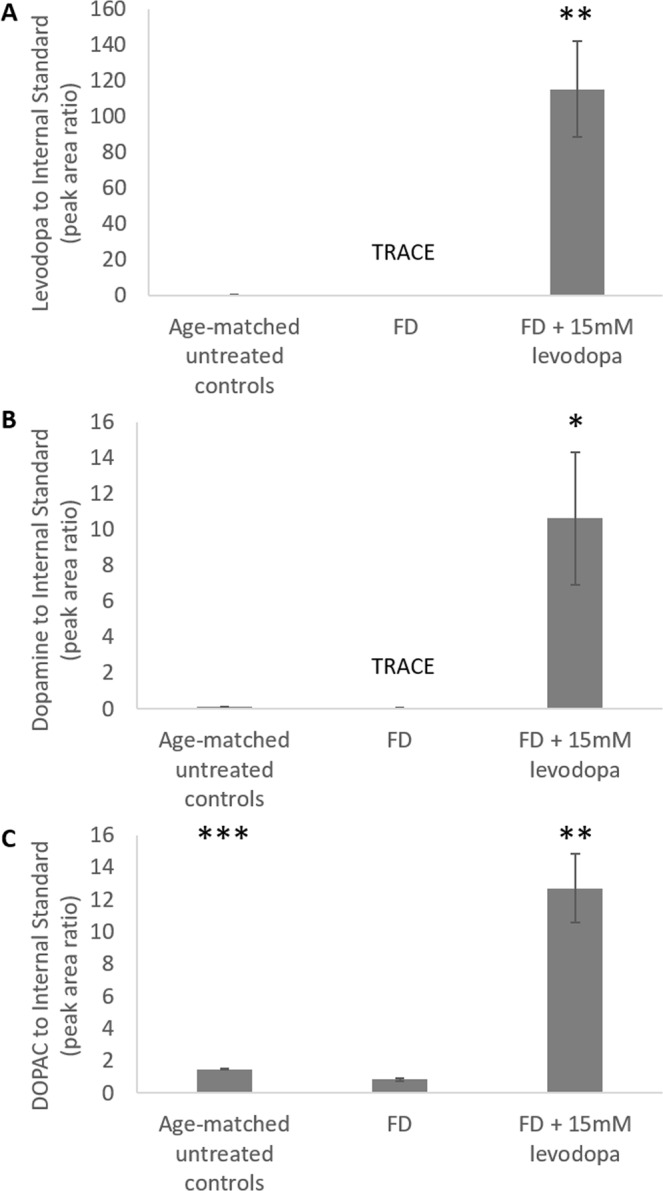
Figure 5.

Vitreal levels of levodopa and its metabolites in form deprived (FD) and levodopa treated chicks. (A) Levodopa (B) dopamine (C) 3,4-dihydroxyphenylacetic acid (DOPAC). Data represents the mean ± standard error of the mean. Statistics denote difference to FD Only; *p < 0.05, **p < 0.02, ***p < 0.001. TRACE denotes when several samples were detected (S/N > 3) but not quantifiable (S/N < 10); levodopa in FD samples fell in this range in 4 out of 5 samples and dopamine in FD samples fell in this range in 2 out of 5 samples.
