
Figure 1.
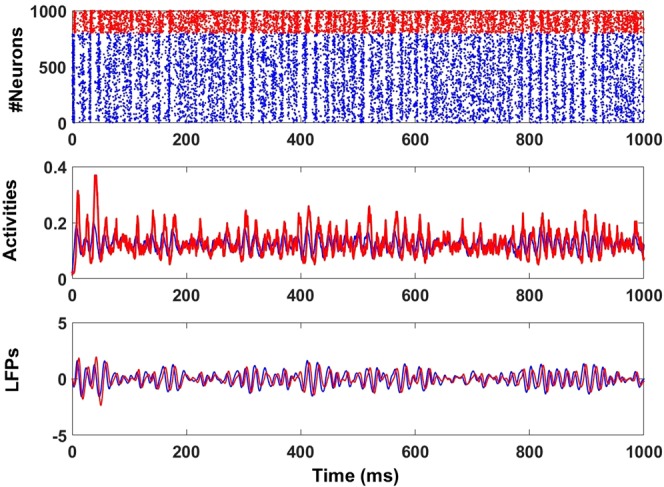
Stochastic oscillatory rhythm generated by a recurrent stochastic Wilson-Cowan (E-I) network (see Methods) working in the transient synchrony regime. Top: Raster plot. Middle: Excitatory E(t) (blue) and inhibitory I(t) (red) activities. Bottom: Excitatory (blue) and inhibitory (red) LFPs. They show epochs of high amplitude corresponding to synchronized activity followed by epochs of low amplitude corresponding to desynchronized or less synchronized activity. Excitatory and inhibitory activities and their corresponding LFPs display a slight phase difference. The raster plot and activities were simulated using the exact Gillespie algorithm41,95). The LFPs were obtained by first removing the signal means from the respective excitatory and inhibitory activities, followed by filtering using a Butterworth second-order filter with a lower cutoff frequency of 20 Hz and upper cutoff frequency of 100 Hz. The parameters are as in Table 1 excepted Wee = 25.3.