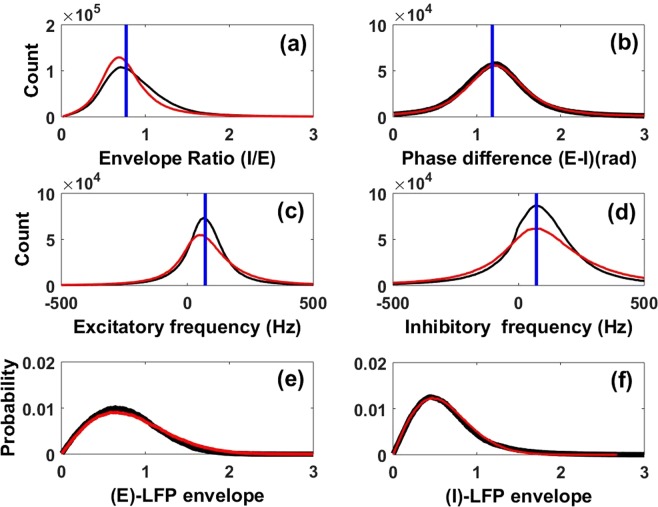
Figure 2.
Properties of analytic versus filtered LFPs. Properties of the envelope and phase of the excitatory and inhibitory LFPs in Eqs. 1 and 2 obtained via the analytic signal technique (see Methods). Shown are the distributions of (a) the ratio of the envelopes of the inhibitory and excitatory LFPs (I/E), (b) the phase difference between E and I LFPs (c), the instantaneous frequency of the excitatory LFP, (d) the instantaneous frequency of the inhibitory LFP, (e) the envelope of the excitatory LFP envelope, and (f) the envelope of the inhibitory LFP. For all panels, distributions in black come from exact numerical simulations of the full nonlinear stochastic Wilson-Cowan neural network with 2-state neurons (Fig. 1 bottom panel), while those in red come from the approximate linear stochastic model, Eqs. 1 and 2. In panels (a–d), the vertical blue lines represent analytical predictions of the means of those distributions (Methods). For panels (a–b), the means were computed using Eq. 19, while for panels (c–d) we use the expression of ω0 right after Eq. 6. The instantaneous frequencies (Panels (e–f)) are obtained as in38.

