
Figure 5.
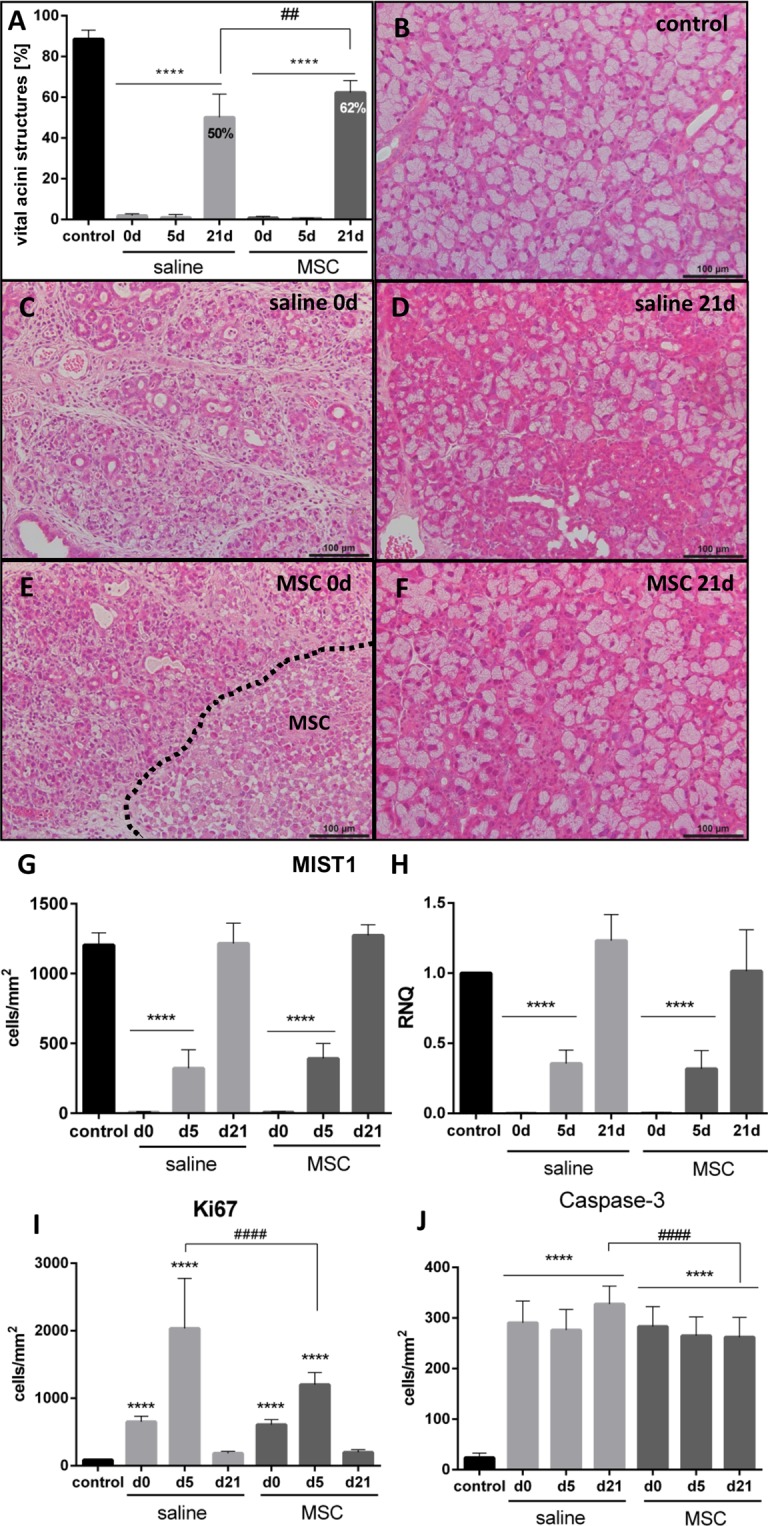
Dynamic of LG damage and regeneration. (A) Area of vital acinar structures calculated in HE stained LG sections. At d21 vital acinar structures recovered to significant higher extent after MSC than saline injection. (B) Control LG had tightly arranged acini, which were organized in lobules and surrounded by few connective tissue. (C,E) Due to DL, LG structure was damaged by interstitial edema, infiltrating cells and shrunken acinar cells with higher eosinophilia. (E) Transplanted MSC were detected in the stroma adjacent to acinar structures (dashed line). (D,F) After re-opening of DL and regeneration, LG structure recovered, and acinar structures re-appeared. (G) The number of MIST1-positive cells in immunohistochemical staining significantly decreased after DL (d0), but gradually increased thereafter and was comparable to control by d21. (H) MIST1 gene expression displayed comparable results to MIST1 immunohistochemical staining. (I) The number of Ki67-positive cells in immunohistochemical staining gradually increased up to d5 and normalized comparable to control at d21. At d5 the number of Ki67-positive cells were significantly higher after saline injection than after MSC injection. (J) The number of caspase-3-positive cells in immunohistochemical staining was significantly elevated at all time points in both groups. The number of caspase-3 positive cells at d21 was significantly elevated in saline injected LGs compared to MSC injected LGs. Data are n = 6, mean ± SD; scale bar: 100 µm. ****Represent p ≤ 0.0001 compared to control; ##represents p ≤ 0.01 and ####represent p ≤ 0.0001 compared between saline and MSC groups.