Figure 7.
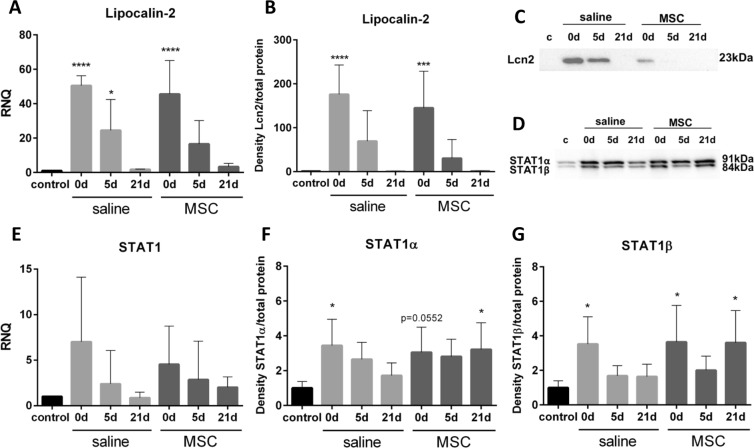
Influence of MSC. (A) Expression of Lipocalin-2 (Lcn2) significantly increased after DL (d0) and then gradually decreased to control level by d21 in both groups. (B,C) Western blot analysis of Lcn2. (B) Quantification of Lcn2 revealed a significant increase 5 min (d0), which decreased to control levels by d21 after saline and MSC injection. (C) Representative pictures of Lcn2 detection by western blot. (D) Representative pictures of STAT1α/β detection by western blot. (E) Expression of STAT1 slightly increased at d0 and d5. (F) Quantification of STAT1α revealed a slight increase at all time points after saline and MSC injection. (G) Quantification of STAT1β revealed a slight increase at all time points after saline and MSC injection. For western blot analysis the samples (n = 42) were run on four blots, which were processed in parallel. Full blots are provided in the supplementary data file. Data are n = 6, mean ± SD. *Represent p ≤ 0.05, ***represent p ≤ 0.001 and ****represent p ≤ 0.0001 compared to control.

