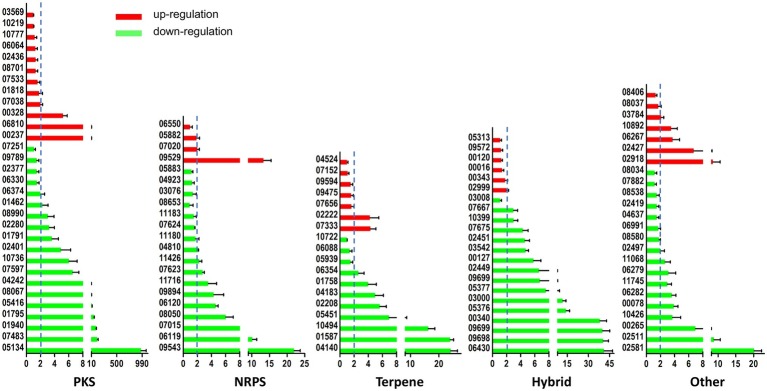
Figure 7.
LaeA influenced the expression level of secondary metabolite biosynthetic genes. Both WT and ΔlaeA had three biological replicates. Y axes represented the backbone genes in PKS, NRPS, Terpene, Hybrid, and other gene clusters. X axes represented the expression ratio of genes expressed in WT compared to that expressed in ΔlaeA.

