Figure 2.
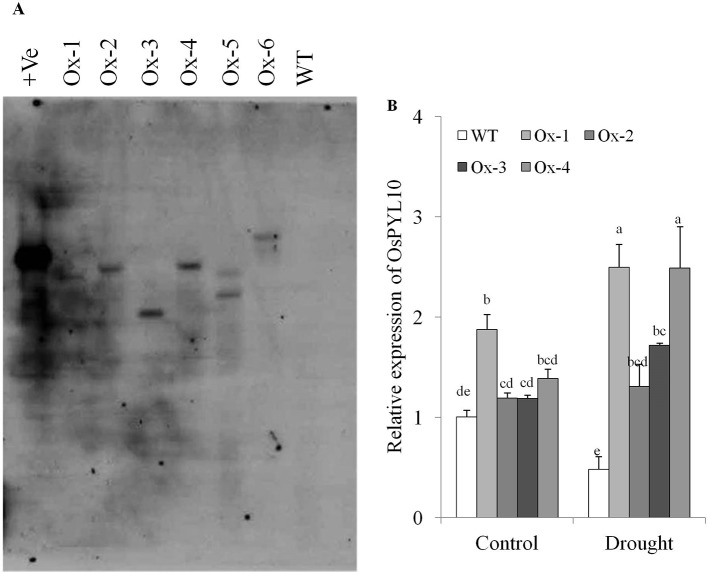
Molecular confirmation of transgenic lines (A) Southern blot analysis of overexpressing OsPYL10 transgenic lines (T1). DNA was extracted from transgenic lines (Ox1, Ox2, Ox3, Ox4, Ox5 and Ox6) and WT plants. 10µg DNA was overnight digested with restriction enzyme (KpnI) and run in 1x TAE gel for 5 h at 50 volt and transferred in nitrocellulose membrane and hybridized with HPTII probe labelled with DIG and autoradiogram was developed. (B) qRT-PCR analysis for relative gene expression in OsPYL10 transgenic lines under control and drought stress conditions. Samples were collected for RNA isolation from control and drought stress (-80kPa; Soil moisture content = 7.6%) conditions. Values shown in graph are mean of three biological replicates (n = 3). Error bar indicates ±SE. Statistical differences are shown on the bars by labelling significantly different groups with different letters.

