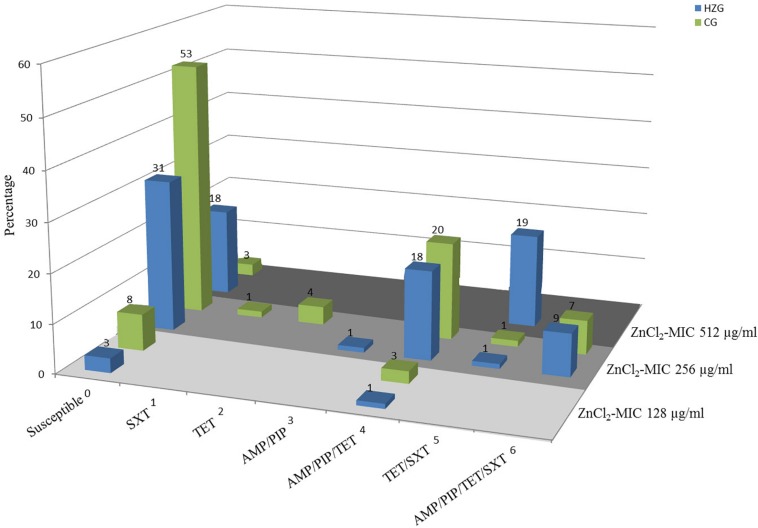
FIGURE 2.
Antibiotic resistance pattern and zinc chloride MICs of porcine intestinal E. coli. Relative (%) distribution of resistance pattern compared with zinc chloride MICs (light gray = ZnCl2 MIC of 128 μg/ml; gray = ZnCl2 MIC of 256 μg/ml; dark gray = ZnCl2 MIC of 512 μg/ml) in high-zinc group (blue) [HZG] and control group (green) [CG]. SXT, sulfamethoxazole-trimethoprim; TET, tetracycline; AMP, ampicillin; PIP, piperacillin.

